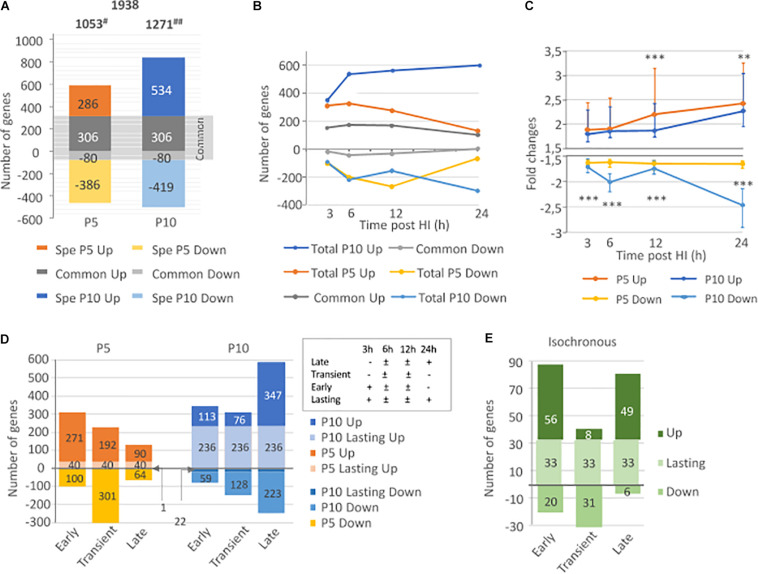
FIGURE 2.
Comparison of HI effects on transcription in the neonate’s brain at P5 and P10. (A) Total number of inductions and repressions (noted as negative values) at P5, P10, and in common to both ages, (B) Time course of induction/repression numbers in P5, P10, and in common, along the 24 h period following HI (C) Comparison of median induction and repression amplitudes (±interquartile) along the 24 h after HI in P5 and P10 brains. (D) Distribution of total P5 or P10 inductions and repressions, classified as early, transient, late, or lasting kinetics (details in inset) (E) Kinetics distribution of genes exhibiting isochronous responses (based on the 4 classes) at both ages. #Includes 5 biphasic effects (induction and repression of single genes) in P5, and ## 68 biphasic regulations in P10 brains. **p < 0.01; ***p < 0.0001 according to Mann and Whitney test.

