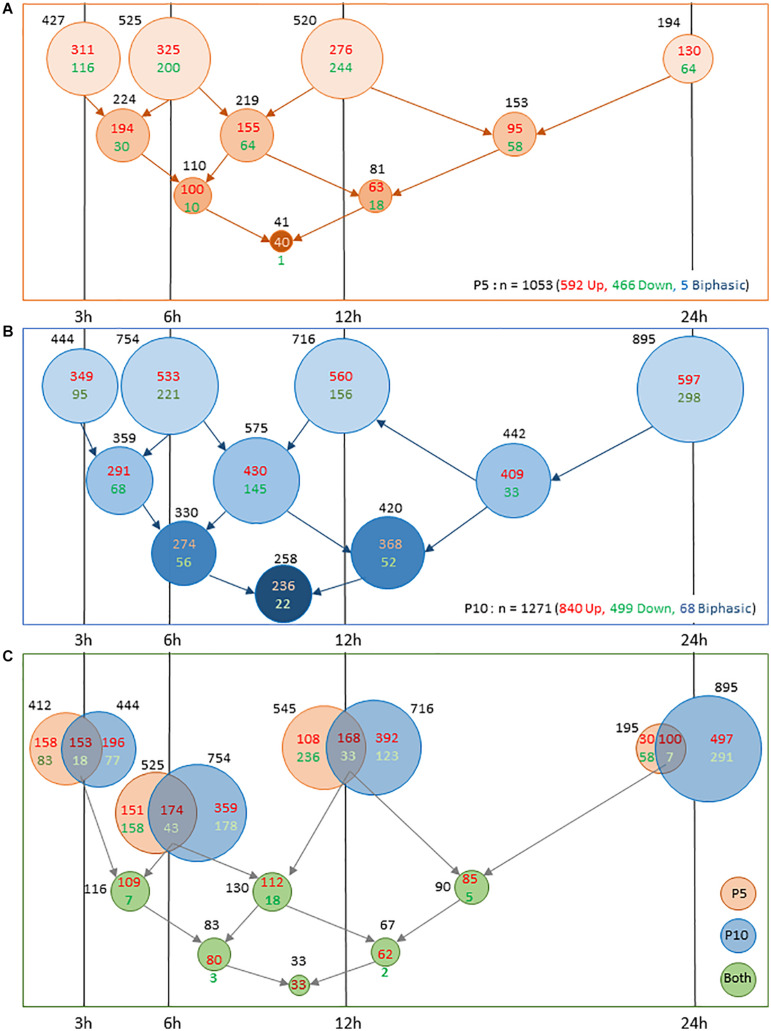
FIGURE 3.
Comparison of number of genes exhibiting transcription response to HI in P5 or P10 brains at the different time intervals post HI. (A) Distribution in P5 mice. (B) Distribution in P10 mice. Lower series of circles indicate numbers of genes present in successive intervals. (C) Coincident transcription responses in P5 and P10 brains at 3, 6 12, and 24 h after HI. Circles overlappings indicate common responses. Bottom rows indicate numbers of common observations at consecutive time points. Induction numbers were noted in red and repressions in green. Disk surfaces were proportional to gene numbers (noted in black).

