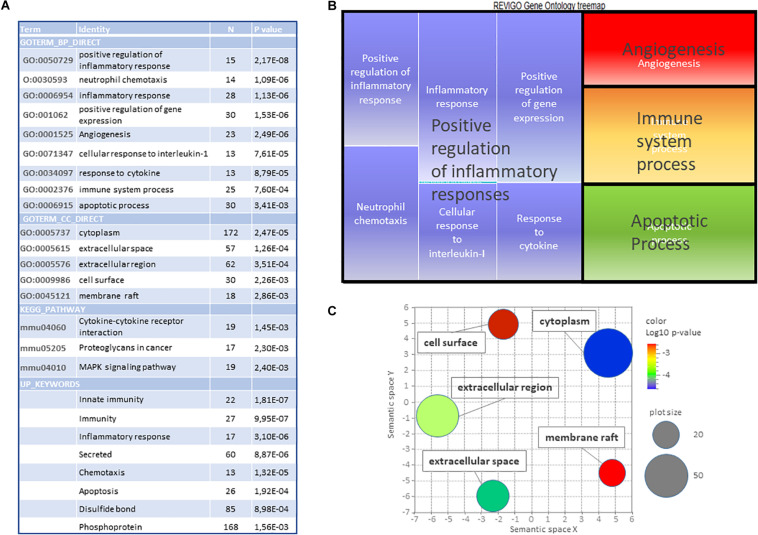
FIGURE 4.
Gene ontology study of the common core of 386 genes affected by HI in P5 and P10 brains. (A) DAVID (v6.8) identification of significantly enriched GO-terms (dispensability < 0.7), Kegg Pathways and Keywords (N ≥ 10, p < 0.01). (B) Treemap representation of biological processes GO terms (BP). (C) Scatterplot representation of cell components (CC) GO terms. Color scale indicates p-values. Circle diameters represent the number of genes associated.

