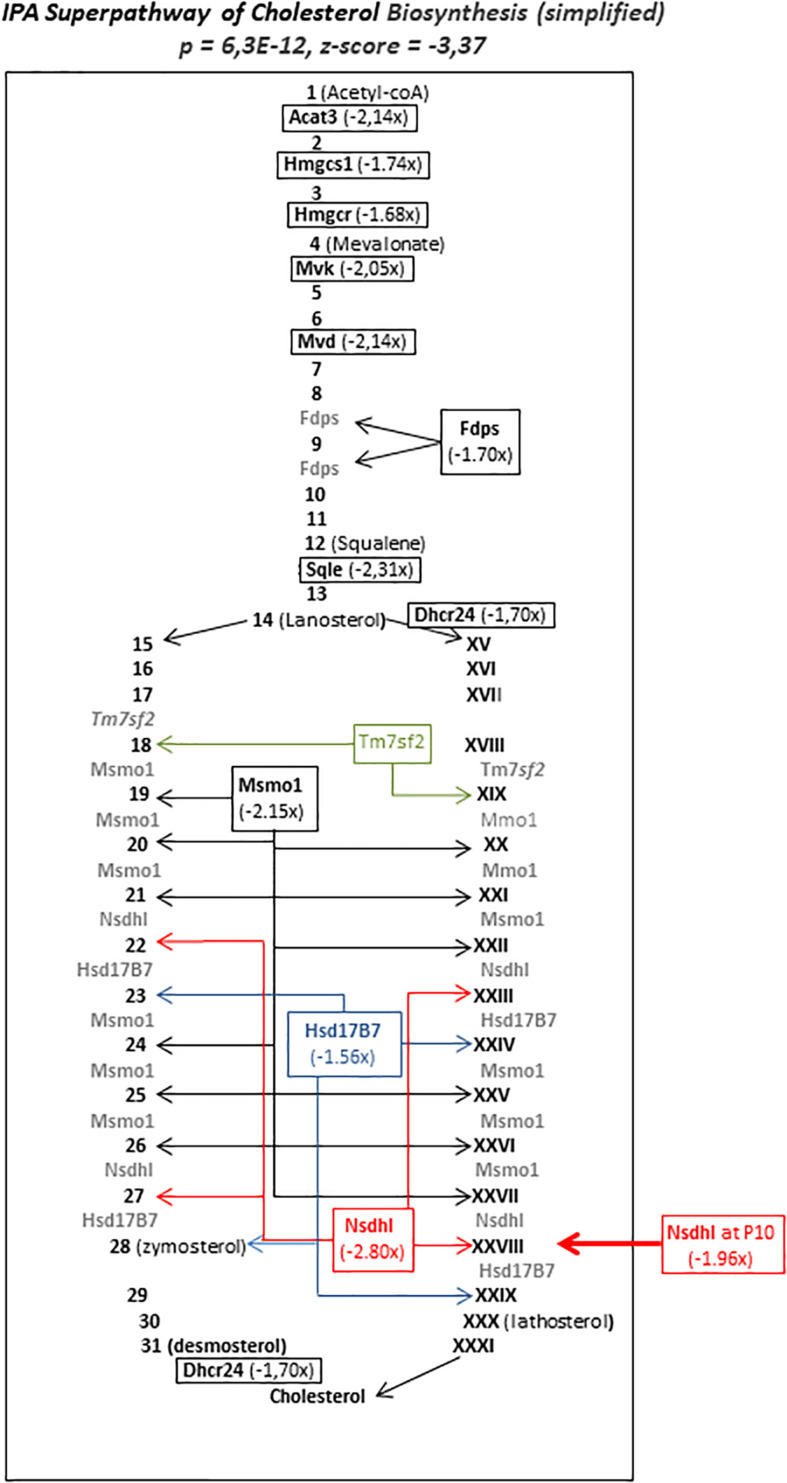
FIGURE 7.
Simplified schematic representation of seIPA-path “super pathway of cholesterol biosynthesis” significantly repressed in P5 brain 12 h after HI (p = 6.3E-12, z-score = –3.37). Repressed genes figure in bold characters. Numbers (Arabic and roman) figure intermediate metabolites in two alternate biosynthesis routes. Values in parentheses indicate fold change inhibition at 12 h after HI. Acat3 enzyme coding gene (in bold italics) does not exist in Human, thus IPA§ release proposed the human homolog Acat2. Arrows indicate the enzyme’s multiple sites of implication. Large Arrow pointed toward Nsdhl, the only gene in this pathway affected by HI at P10.

