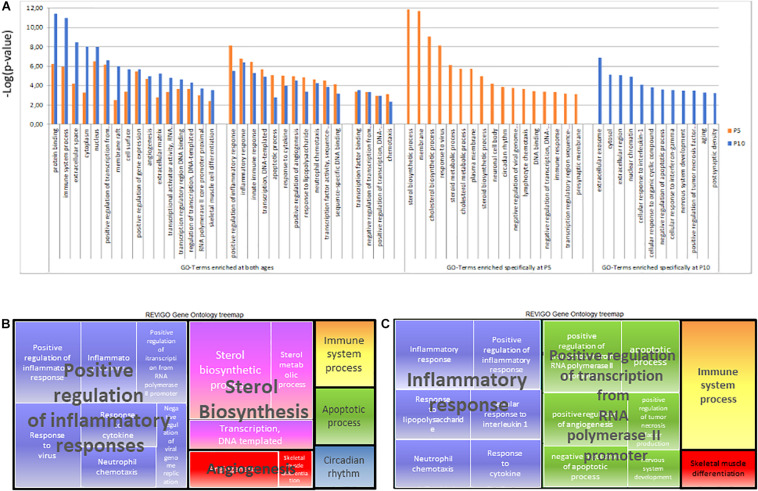
FIGURE 8.
Gene ontology analysis of P5 or P10 lists of genes affected after HI. (A) List of terms identified using David and selected at dispensability score < 0.7 using Revigo. Enrichment significance was shown as –log(p-value) according to BH corrected t-test at P5 (orange) and P10 (blue). (B) Treemap of Biological Processes GOterms in P5 brain. (C) Treemap of Biological Processes GOterms in P10 brain.

