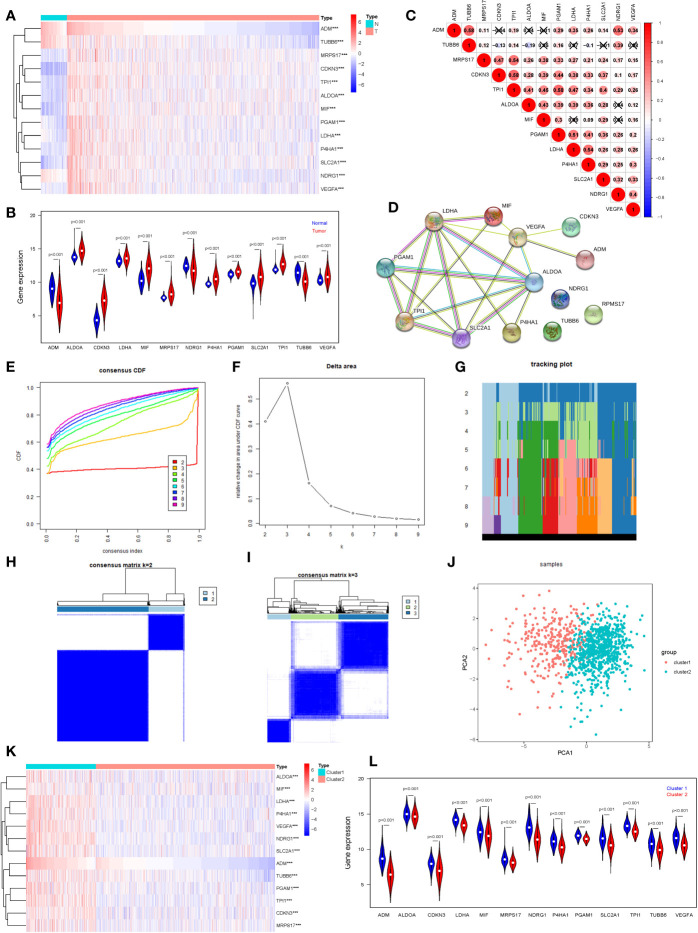
Figure 1.
Consensus Clustering identified two clusters of BRCA with different hypoxia status. (A) The heatmap of the 13 hypoxia related gene expression signature in TCGA BRCA tumor and normal samples (Wilcox Test). (B) The expression of the 13 hypoxia related gene expression signature in TCGA BRCA tumor and normal samples (Wilcox Test). (C) Spearman correlation analysis of the 13 hypoxia related gene expression signature. (D) The PPI network of the 13 hypoxia related gene expression signature. (E) The CDF value of consensus index. (F) Relative change in area under CDF curve for k = 2–9. (G) The tracking plot for k = 2 to k = 9. (H, I) Consensus matrix for k=2 and k=3. (J) Principal component analysis of the total RNA expression profile. (K) The heatmap of the 13 hypoxia related gene expression signature in cluster1 and cluster2 (Wilcox Test). (L) The expression of the 13 hypoxia related gene expression signature in cluster1 and cluster2 (Wilcox Test). ***P < 0.001.

