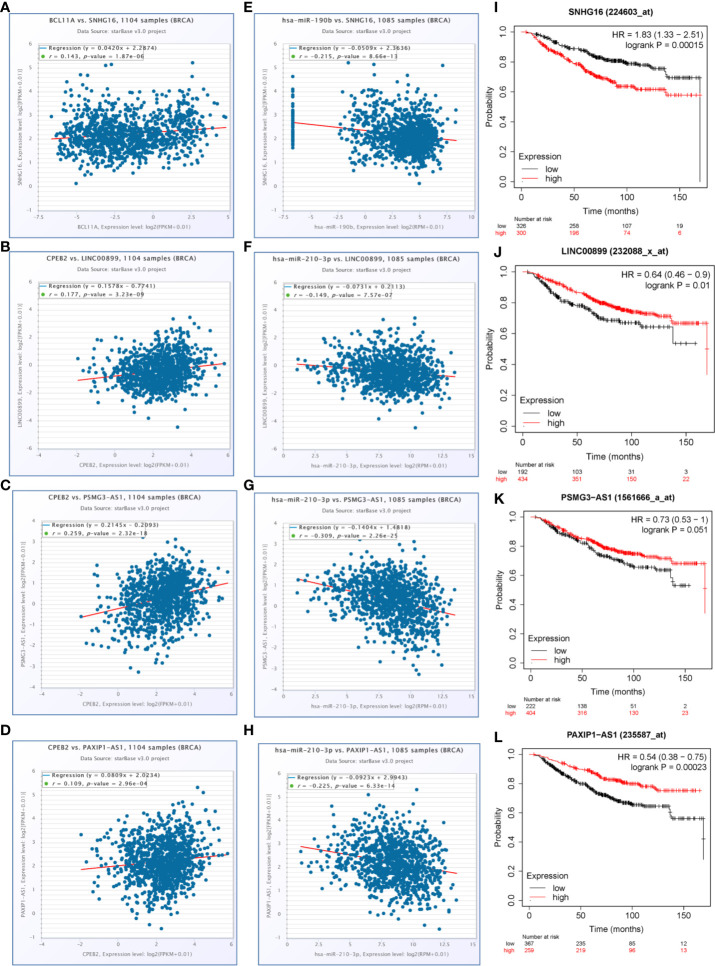
Figure 7.
LncRNAs selected for the hypoxia related competitive endogenous RNA (ceRNA) regulation network. (A–D) The positive correlations between candidate genes and selected lncRNAs (P<0.05, r>0.1). (E–H) The negative correlations between candidate miRNAs and selected lncRNAs (P<0.05, r<−0.1). (I–L) The overall survival curves of selected lncRNAs in breast cancer patients estimated by the Kaplan Meier plotter.

