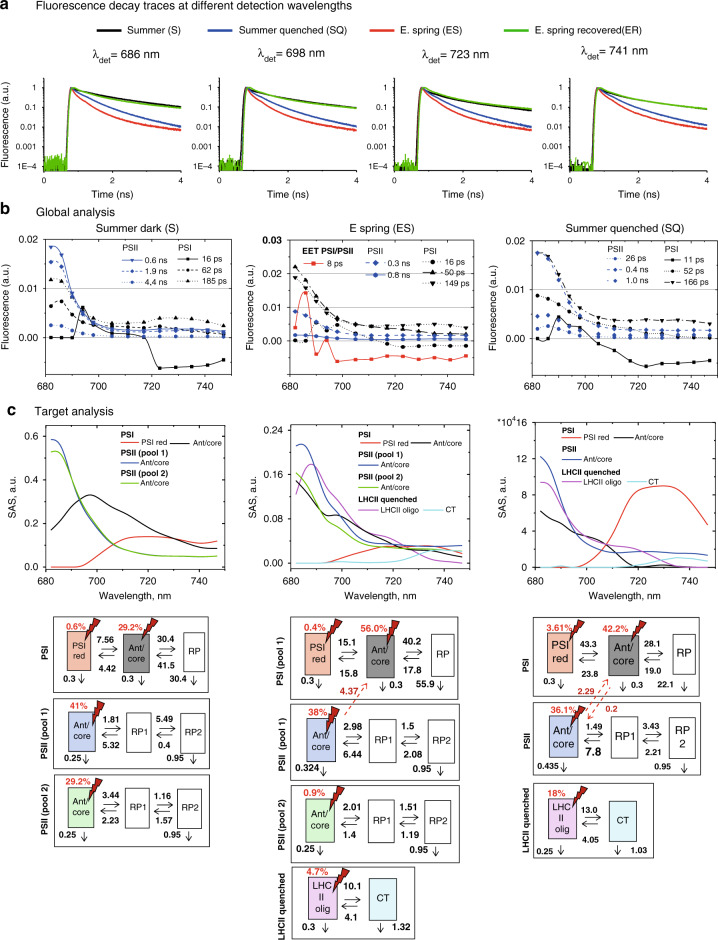
Fig. 3. Time-resolved fluorescence of intact pine needles measured using TCSPC.
(a) Fluorescence decay traces measured at −20 °C and at four characteristic wavelengths: 686 nm (mainly PSII, LHCII contributions), 698 nm (PSII, PSI contributions), 723 nm (mainly PSI contribution), and 741 nm (mainly PSI contribution). (b) Global analysis of pine needles in three states: Summer dark (S, dark-adapted summer needles, left row), ES (E.spring needles with “sustained quenching” present, middle row), Summer quenched (SQ, right row) (c) Kinetic target analysis of pine needles in the three states. See the main text for the explanations. The kinetic target analysis (SAS top, a kinetic model with rate constants in ns-1, bottom) shows the results of the detailed target modeling of the fluorescence kinetics of pine needles. The rate constants (ns−1) and Species-associated emission spectra (SAS) resulted were determined from global target analysis. Species-associated emission spectra (SAS) resulted from the fit of the target kinetic model in the corresponding state. Note that fluorescence decay measurements below 680 nm to detect the decreasing short-wavelength part of the spectra were not possible due to the extremely high scattering of the pine needles. This has no effect however on the ability to distinguish the various lifetime components kinetically and spectrally.

