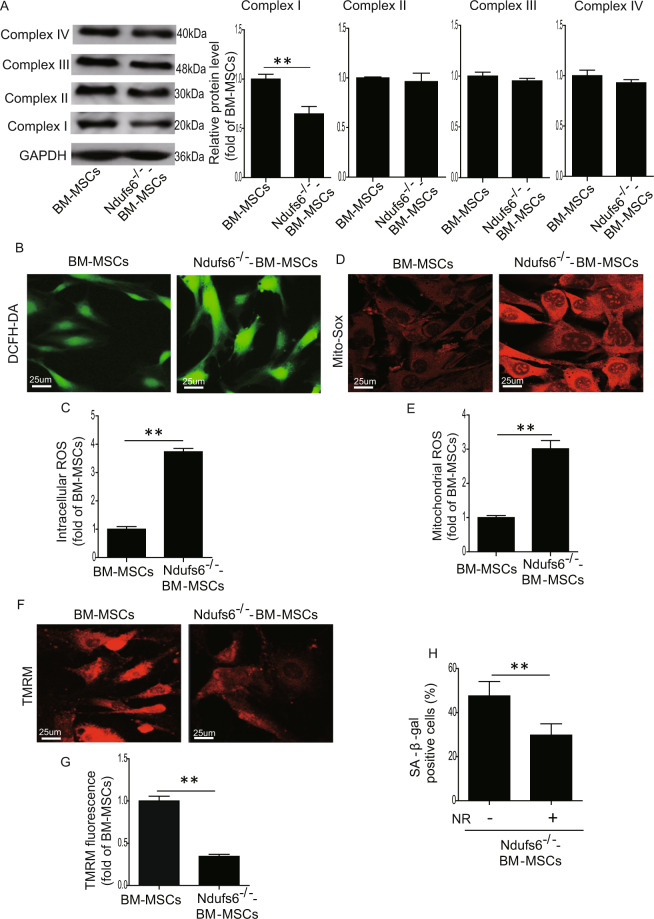
Fig. 5. Ndufs6−/−-BM-MSCs exhibit complex I deficiency and enhanced ROS generation.
A The protein level of complexes I, II, III, and IV was evaluated in BM-MSCs and Ndufs6−/−-BM-MSCs. B The intracellular ROS of BM-MSCs and Ndufs6−/−-BM-MSCs was measured by DCFH-DA staining. C The intracellular ROS of BM-MSCs and Ndufs6−/−-BM-MSCs was statistically quantified. D The mitochondrial ROS of BM-MSCs and Ndufs6−/−-BM-MSCs was measured by Mito-Sox staining. E The mitochondrial ROS of BM-MSCs and Ndufs6−/−-BM-MSCs was statistically quantified. F The MMP of BM-MSCs and Ndufs6−/−-BM-MSCs was assessed by TMRM staining. G The MMP of BM-MSCs and Ndufs6−/−-BM-MSCs was statistically quantified. H NR treatment decreased cellular senescence in Ndufs6−/−-BM-MSCs. Results are presented as mean ± SD. n = 3. **p < 0.01.

