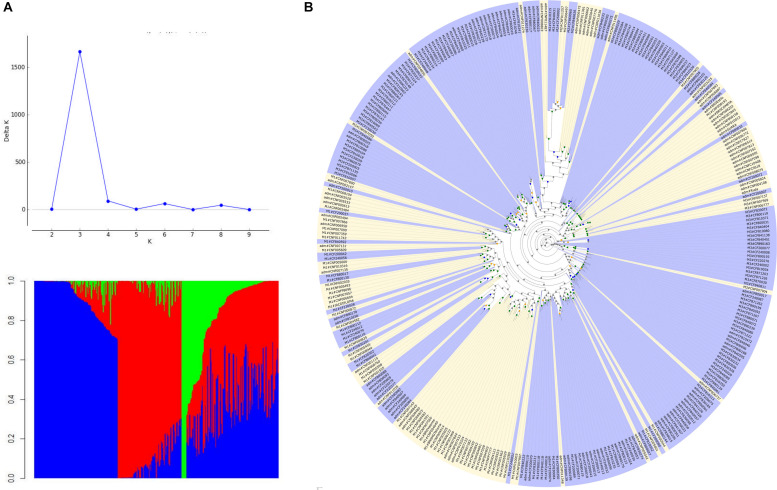
FIGURE 3.
Population structure and best scoring maximum likelihood tree based on the genotyped data sets. (A) Population structure for the Mesoamerican germplasm (K = 3) showing, predominantly, lines/cultivars (M1, red), landraces with large grains (M2, green), landraces with a wide variation of commercial grain types (M3, blue); (B) phylogenetic tree where the range of branch support was depicted at the nodes (gray dots: 0–60; orange dots: 60–70; blue dots: 70–85; and green dots: 85–101); landrace germplasms are marked in blue and the lines/cultivars in yellow; the names of genotypes are shown on the top of the corresponding clades and integrate information on to which structure group they belong.

