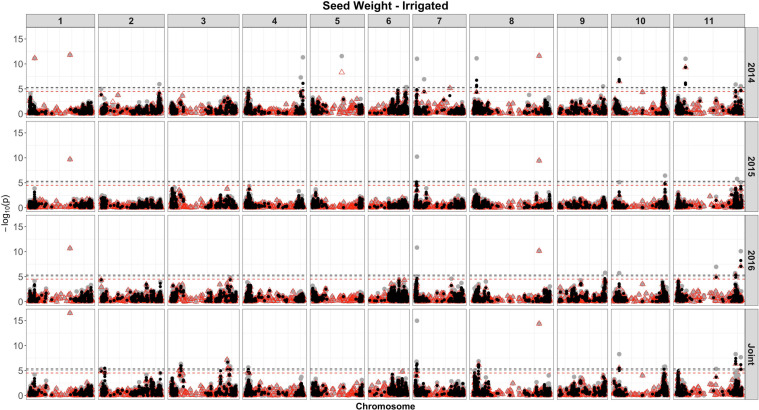
FIGURE 4.
Manhattan plot of the associations for SW for common bean, under irrigation, using a single-based GWAS (gray circle), segment-based GWAS (red triangle), and gene-based GWAS (black circle) based on the role set of experimental data. Gray, red, and black lines indicate Bonferroni-corrected threshold with an experimental type I error rate at α = 0.05.

