FIGURE 6.

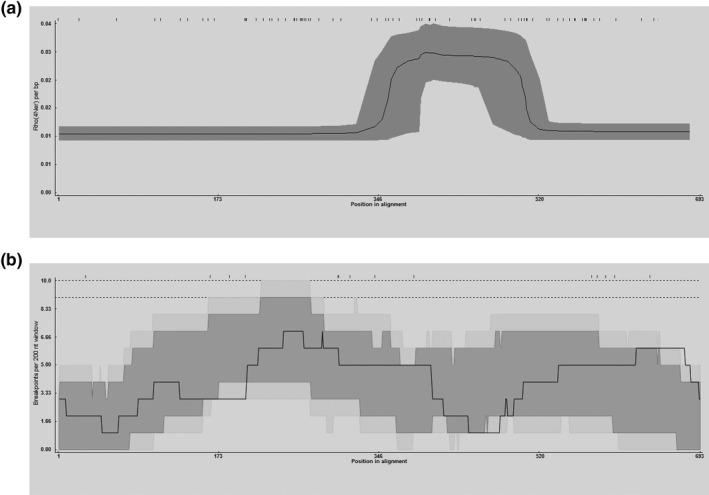
Recombination rates and distribution of breakpoints. The x‐axis refers to the positions of informative sites. The y‐axis in A represents Rho (4Ner) per base pair and the y‐axis in B represents breakpoints per 200‐nucleotide window

Recombination rates and distribution of breakpoints. The x‐axis refers to the positions of informative sites. The y‐axis in A represents Rho (4Ner) per base pair and the y‐axis in B represents breakpoints per 200‐nucleotide window