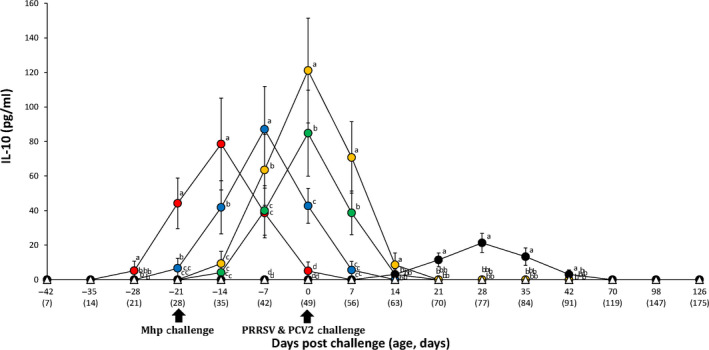
FIGURE 6.

Mean values of interleukin‐10 in the serum samples in the different groups: VacA113/Ch ( ), VacA123/Ch (
 ), VacA133/Ch (
 ), VacB333/Ch (
 ), UnVac/Ch (
 ) and UnVac/UnCh (
 ) groups. Variation is expressed as the standard deviation. Different letters within a sampling point mean statistically significant differences (p < .05)
