
Figure 3.
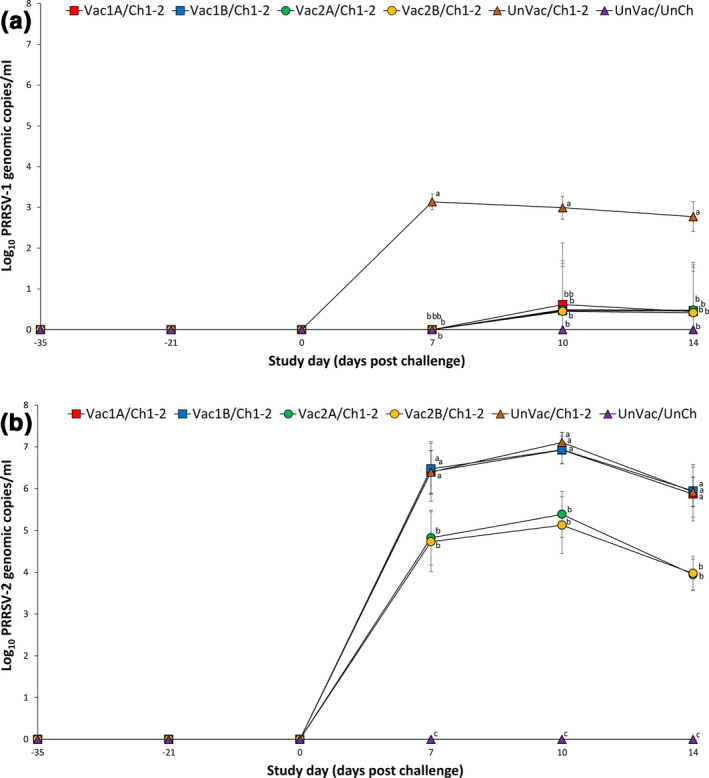
Mean (with standard deviation) of the number of genomic copies of PRRSV‐1 RNA (a) and PRRSV‐2 RNA (b) in serum samples of pigs from six groups. Different letters (a, b and c) at days post challenge indicate significant differences among groups