
Figure 4.
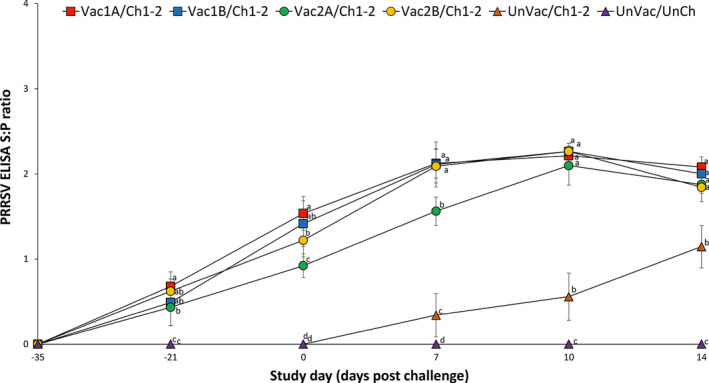
Mean (with standard deviation) for PRRSV ELISA sample‐to‐positive (S/P) ratio in serum samples of pig from six groups. Different letters (a, b and c) at days post challenge indicate significant differences among groups
Official websites use .gov
A
.gov website belongs to an official
government organization in the United States.
Secure .gov websites use HTTPS
A lock (
) or https:// means you've safely
connected to the .gov website. Share sensitive
information only on official, secure websites.
Mean (with standard deviation) for PRRSV ELISA sample‐to‐positive (S/P) ratio in serum samples of pig from six groups. Different letters (a, b and c) at days post challenge indicate significant differences among groups