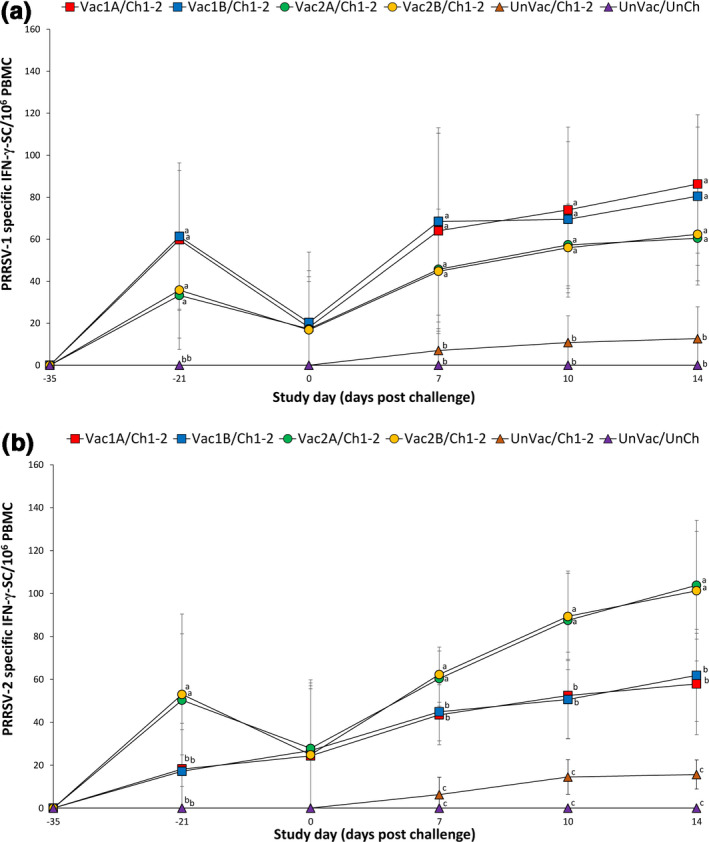
Figure 5.

Mean (with standard deviation) of PRRSV‐1 specific IFN‐γ‐SC (a) and PRRSV‐2 specific IFN‐γ‐SC (b) in peripheral blood mononuclear cells of pigs from six groups. Different letters (a, b and c) at days post challenge indicate significant differences among groups
