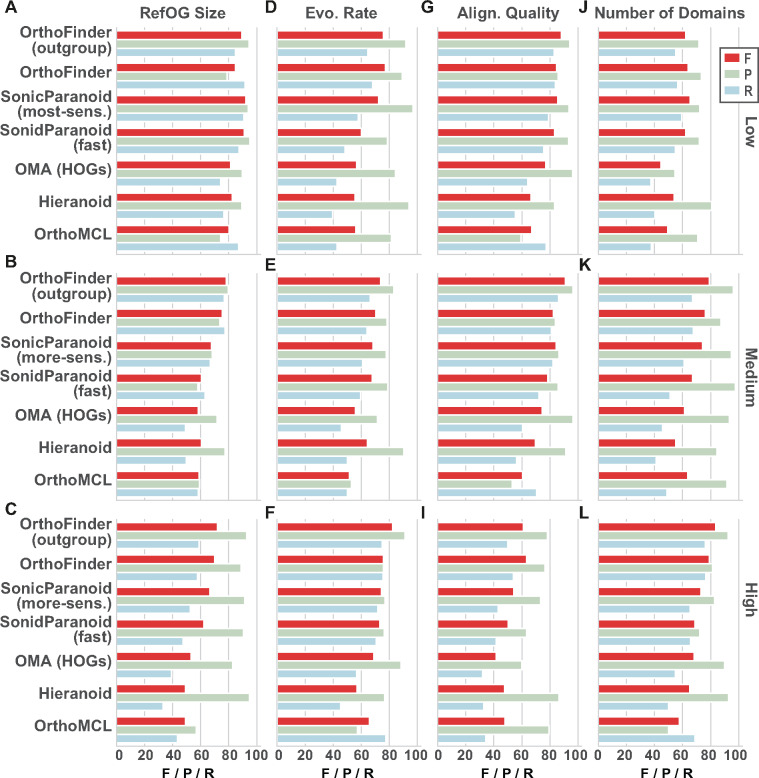
Fig. 3.
Breakdown of the precision (P), recall (R), and F-score (F) of the methods under different levels of technical challenges to orthogroup inference. (A–C) RefOG size, N. (A) Low, N < 15; (B) medium, 15 ≤ N < 31; and (C) high, N ≥ 31. (D–F) Evolutionary rate measured my mean sequence identity, I. (D) Low evolutionary rate, I > 73.8%; (E) medium, 62.4% < I ≤ 73.8%; and (F) high, I ≤ 62.4%. (G–I) Alignment quality, Q = norMD. (G) Low, Q < 0.88; (H) medium, 0.88 ≤ Q ≤ 1.15; and (I) high, Q > 1.15. (J–L) Number of domains, D. (J) Low, D = 1; (K) medium, 2 ≤ D ≤ 3; and (L) high, D > 3.

