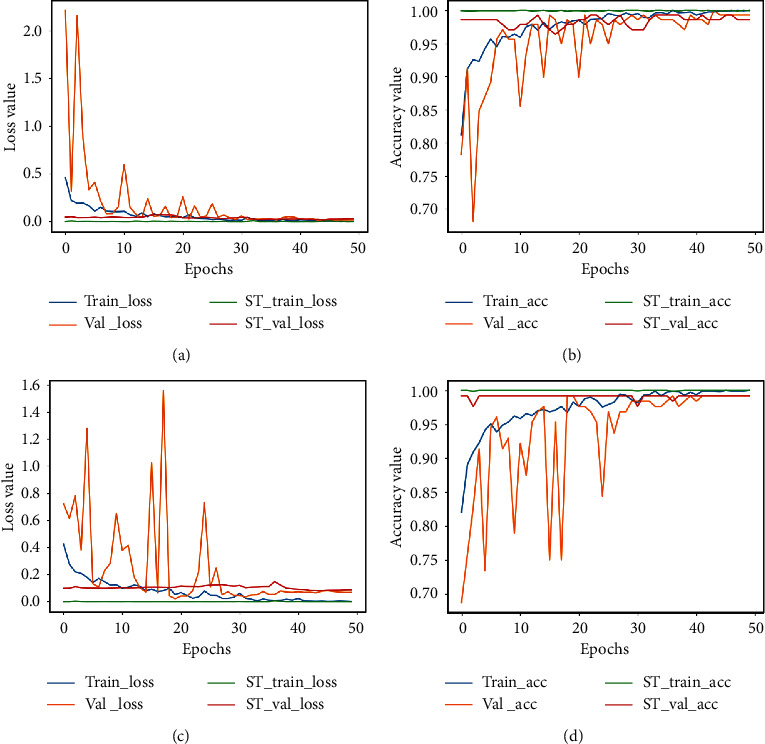
Figure 4.

Accuracy plot for images scanned at 200X and 400X for the binary classification task. (a) The loss plot for 200X and (b) the corresponding accuracy plot. (c) The loss plot for 400X and (d) the corresponding accuracy plot. ST represents the self-training plot.
