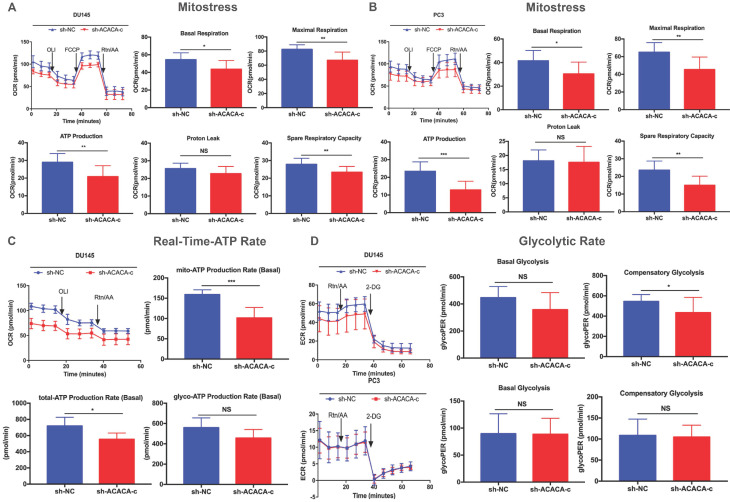
Figure 4.
Mitochondrial function was reduced on knocking down ACACA gene in DU145 and PC3 cell lines. (A-B) Detected OCRs in the DU145 and PC3 cells by seahorse XF96 Mito-Stress kit under basal conditions and in response to specific inhibitors. The fundamental parameters of mitochondria function were presented through a histogram. (C) OCR in the DU145 cells was analyzed by the seahorse XF96 Real-Time-ATP-Rate kit. ATP production was analyzed in the bar graph. (D) ECR indicated the glycolytic rate in DU145 and PC3 cells by the seahorse XF96 Glycolytic-Rate kit. Data were presented as Mean ± SD. *P < 0.05. **P < 0.01. *** P < 0.001.

