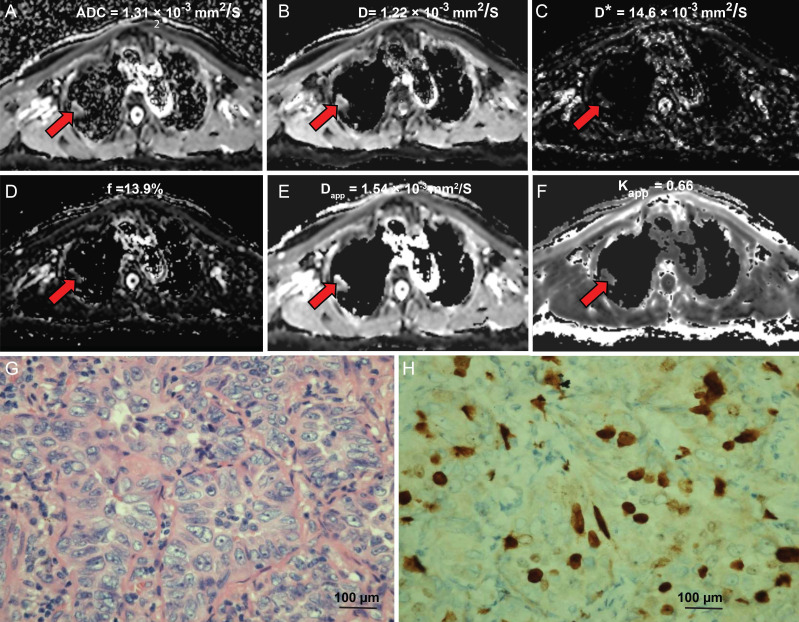
Figure 2.
An 80-year-old male diagnosed with lung adenocarcinoma. (A) An axial ADC map shows a hypointense mass in the left pulmonary lobe (red arrow), with an ADC value of 1.13×10⁻³mm2/s. (B) A diffusion map demonstrating a D value of 1.22×10⁻³ mm2/s. (C) A pseudodiffusion coefficient map demonstrating a D* value of 14.63×10⁻³ mm2/s. (D) A perfusion fraction map showing an f value of 13.94%. (E) A diffusion map showing a Dapp value of 1.54×10⁻³ mm2/s. (F) A kurtosis map showing a Kapp value of 0.66. (G) Hematoxylin and eosin (H&E) staining confirms the mass to be lung adenocarcinoma (magnification, ×400, scale bar, 100 µm). (H) Ki-67 immunohistochemical labeling shows that approximately 10% of cells are positive for nuclear staining (magnification, × 400, scale bar, 100 µm).

