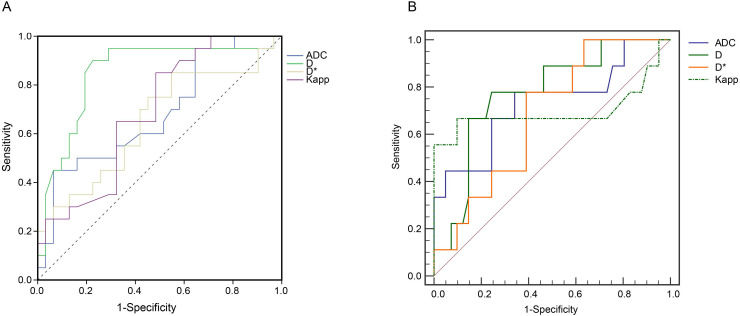
Figure 4.
Receiver operating characteristic (ROC) curve analyses. (A) ROC curve analyses show the diagnostic performance of ADC, D, D*, Kapp in distinguishing the high Ki-67 group from the low Ki-67 group. D values produced the highest AUROC of 0.85 (95% CI: 0.73 - 0.97, P < 0.05). (B) ROC analysis of ADC, D, Dapp, and Kapp in differentiating SCLC and NSCLC. The 2 × 2 contingency analyses, including the cut-off values, sensitivities, specificities, Youden indices, and F1 scores, are listed in Table 3 and Table S4. The raw data are shown in Table S5. ADC: Apparent diffusion coefficient; D: true diffusion coefficient, D* value: perfusion-related pseudodiffusion coefficient; f: perfusion fraction; Kapp: diffusion kurtosis; Dapp: diffusivity; AUROC: Area under ROC curve; CI: confidence interval; SCLC: small cell lung cancer; NSCLC: non-small cell lung cancer.

