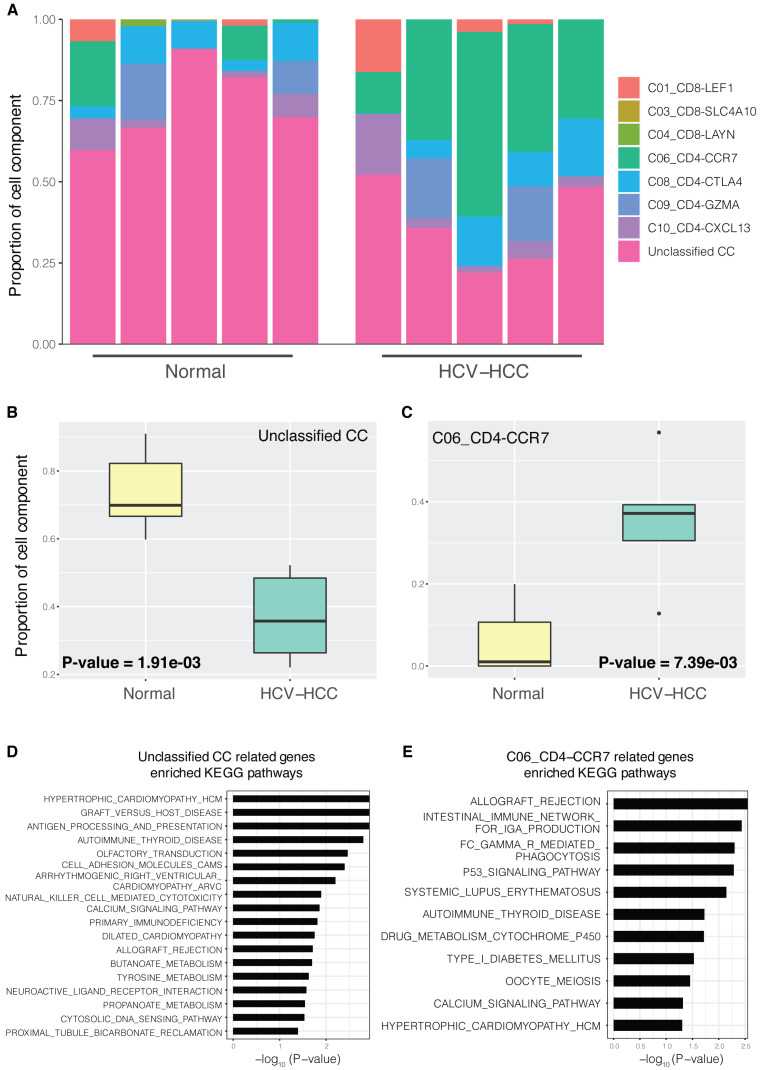
Figure 1.
CCs in HCV-HCC and normal control tissues. (A) Proportion of CCs in different samples; normal control group (left) and HCV-HCC group (right); n=5 per group. Each bar represents one sample, and different colors in each bar represent a single cell component. (B and C) Boxplot of significantly different CC proportions between the HCV-HCC and normal control groups (two-tailed t-test; P<0.05). (B) Unclassified CC. (C) C06_CD4-CCR7 cell component. (D and E) KEGG pathway enrichment results for two significantly different CCs; the x-axis represents -log10 (P-value), where P is the significant value for enrichment. KEGG pathway names are presented on the y-axis. (D) Unclassified CC. (E) C06_CD4-CCR7. CC, cell component; HCV-HCC, HCV-induced HCC; KEGG, Kyoto Encyclopedia of Genes and Genomes.

