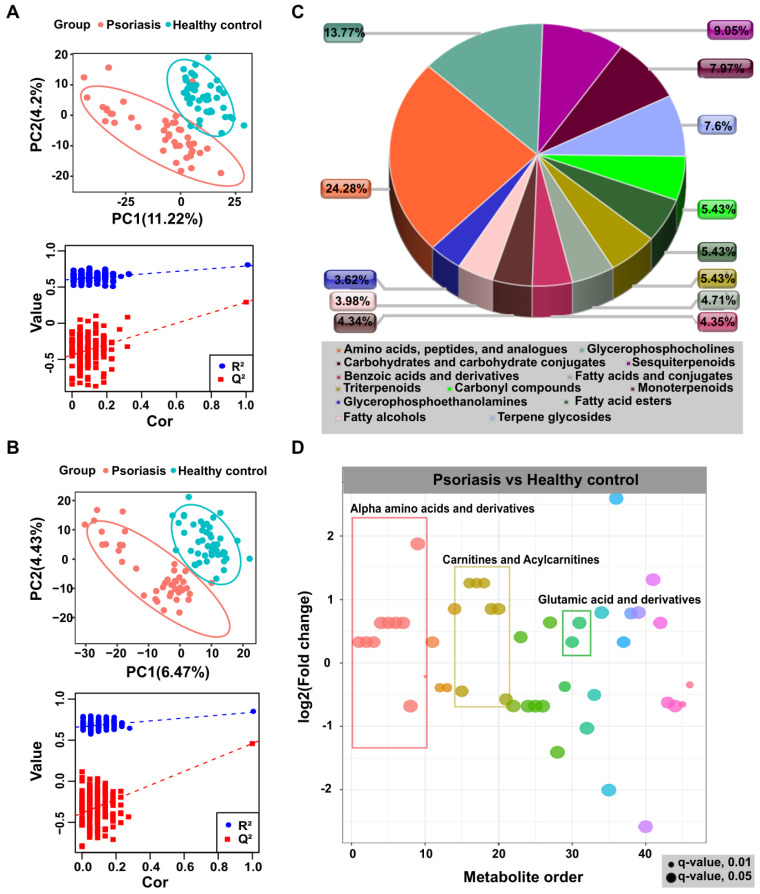
Figure 1.
Non-targeted metabolomics profiling analysis for human plasma. PLS-DA score plots from the healthy and psoriasis groups in (A) positive mode and (B) negative mode. Validation plots were obtained from 200 permutation tests in (A) positive mode (R2 = 0.791, Q2 = 0.291) and (B) negative mode (R2 = 0.839, Q2 = 0.458). (C and D) Metabolomics profiling annotation using database searching and metabolic network analysis to explore the corresponding identification and functional enrichment.

