Figure 5.
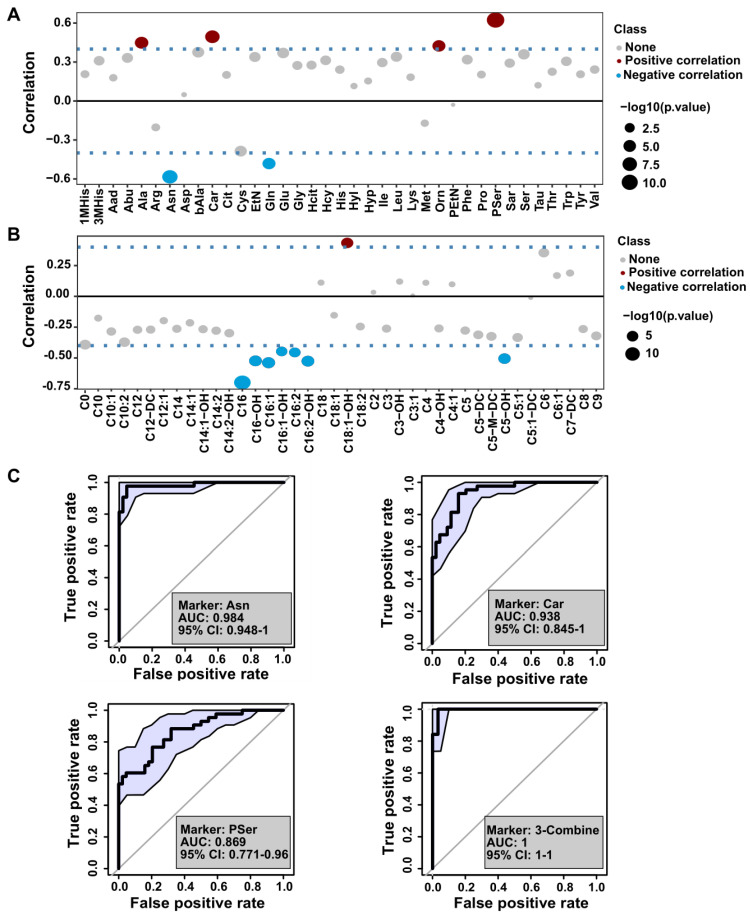
Biomarker analysis of the amino acids and acyl-carnitines with the severity of psoriasis. (A and B) The distribution of Pearson correlation coefficients between PASI score and amino acids or acyl-carnitine. (C) Receiver operating characteristic (ROC) curve based on the selected amino acids using single and combination analysis.

