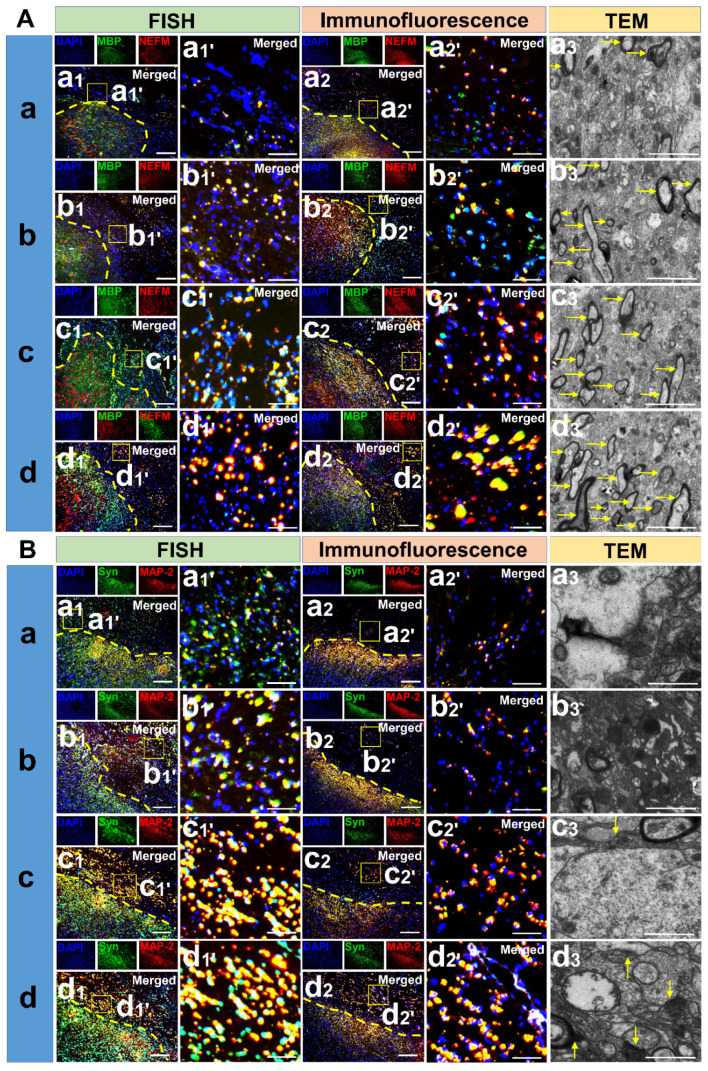
Figure 9.
Detection of neural regenerative markers among groups. (A) mRNA and protein expression of MBP and NEFM along with TEM scanning in the cerebral cortex lesion of each group. Scale bars: 200 µm (a1-d1 & a2-d2), 50 µm (a1'-d1' & a2'-d2'), 5 µm (a3-d3). (B) mRNA and protein expression of Syn and MAP-2 along with TEM scanning in the cerebral cortex lesion of each group. Scale bars: 200 µm (a1-d1 & a2-d2), 50 µm (a1'-d1' & a2'-d2'), 5 µm (a3-d3).

