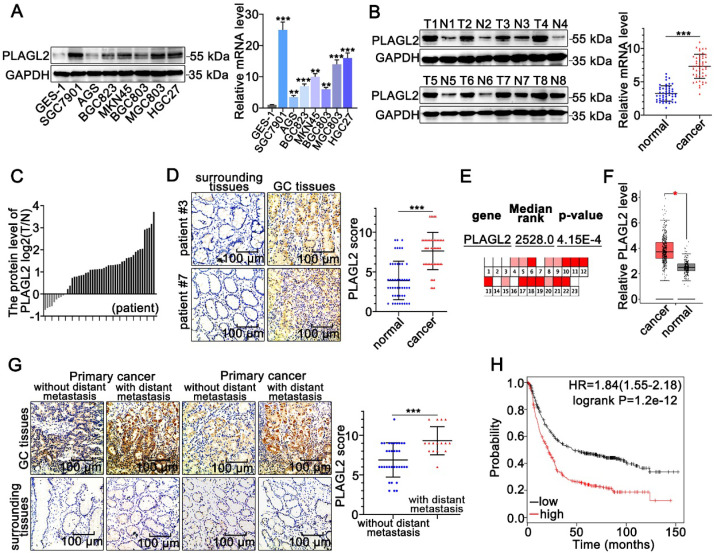
Figure 1.
PLAGL2 is highly expressed in GC. (A) WB and qRT-PCR analyses of PLAGL2 expression in human GC cell lines and GES-1. (B) WB and qRT-PCR analyses of PLAGL2 expression levels in clinical GC specimens. T, GC tissue; N, paired normal tissues. (C) Quantitative analysis of relative PLAGL2 expression in 49 paired GC tissues. (D)Representative IHC images of the PLAGL2 expression levels in paired GC tissues. Scale bars, 100 µm. (E) A meta-analysis of the PLAGL2 gene expression derived from the Oncomine database. (F) A box plot reflecting the PLAGL2 expression in GC specimens and normal specimens was obtained from the GEPIA database (G) Representative IHC images of the PLAGL2 expression levels in primary GC tumors without metastasis vs. GC tumors with metastasis. Scale bars, 100 µm. (H) Kaplan-Meier survival analysis of overall survival based on PLAGL2 expression in GC patients.

