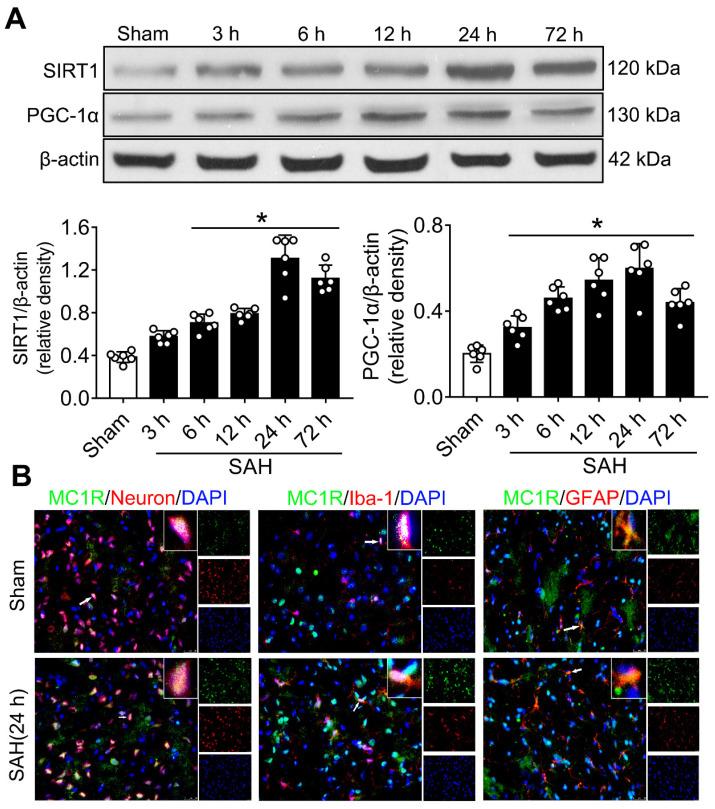
Figure 1.
The expression of MC1R, SIRT1 and PGC-1α. (A) Representative western blot images and quantitative analyses of SIRT1 and PGC-1α of the time course study in samples obtained from the left hemisphere after SAH; n = 6 for each group. Data were shown as means ± SD, and were compared by 1-way ANOVA followed by the Tukey post-hoc test. *p < 0.05 vs. sham; (B) Representative microphotographs of immune-fluorescence staining, showing colocalization of MC1R (green) with NeuN, iba-1, and GFAP (all red) 24 h in the sham and SAH (24 h) groups. (n = 2 for each group). Scale bar = 50 μm.

