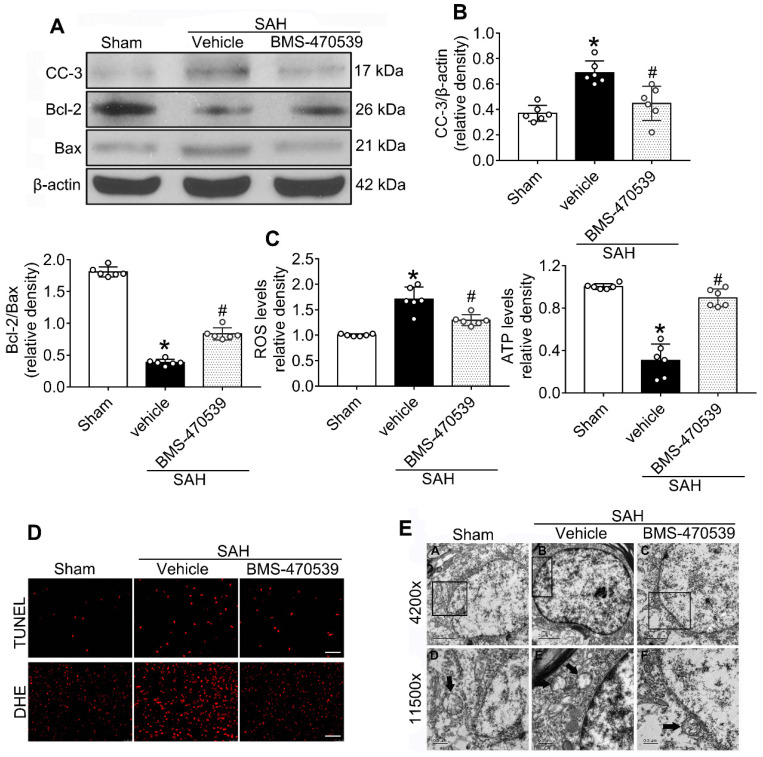
Figure 3.
Neuroprotective effects of BMS-470539 on rats subjected to SAH. (A-B) Representative western blot images and quantitative analyses of cleaved caspase-3 (cc-3), Bcl-2 and Bax, n = 6 per group; (C) The levels of ROS and ATP, n = 6 per group; (D) Representative images of immunofluorescence staining of TUNEL and DHE, n = 4 per group, Scale bar = 50 μm; (E) Transmission electron microscopy images of the morphometric changes of the brain tissues in sham, SAH + vehicle, and SAH + BMS-470539 groups (scale bar = 2 μm for 4200 x; scale bar = 0.5 μm for 11500 x), n = 3 per group. The data were shown as means ± SD, and were compared using 1-way ANOVA followed by the Tukey post-hoc test. *p < 0.05 vs. sham, &p < 0.05 vs. SAH + vehicle.

