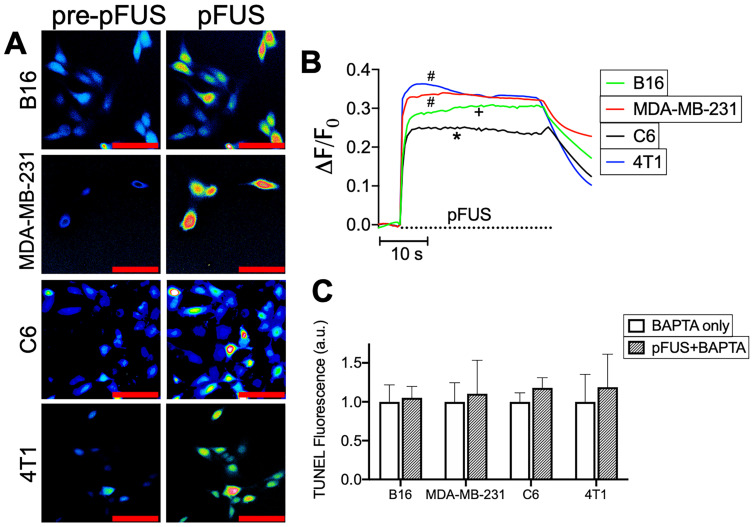
Figure 2.
pFUS activates cytosolic Ca2+ transients in tumor cells and intracellular Ca2+ chelation suppresses pFUS-induced TUNEL reactivity. A) Representative imaging of Fluo-4 fluorescence before and during sonication (psuedocolor; scale bars = 50 μm) and B) fluorometric traces of Fluo-4 intensity before and during sonication (n = 69-130 per cell type; dashed line represents sonication time). Groups with like symbols are statistically similar to each other and significantly different from groups denoted by other symbols following ANOVA comparing peak magnitudes of each group. C) Quantification of TUNEL reactivity in cells with or without pFUS in the presence of intracellular BAPTA (n = 9 per group per cell type). Statistical significance was tested between control and treated groups using t-tests for each cell line.

