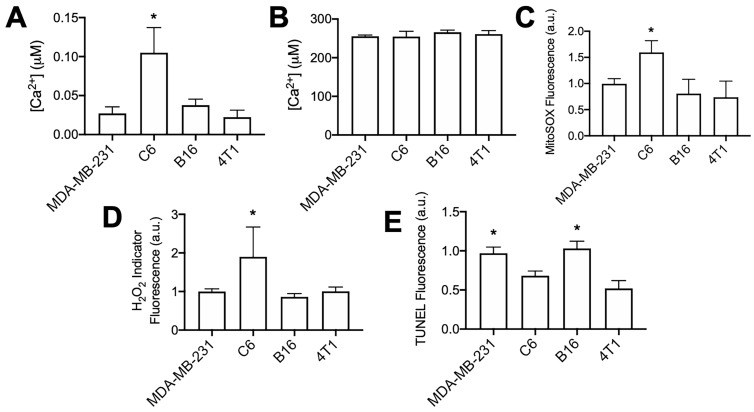
Figure 5.
Unsonicated C6 cells have elevated concentrations of cytosolic Ca2+, superoxide, and H2O2 compared to other unsonicated cells types, not higher levels of TUNEL reactivity. A) Ca2+ quantification in cytosolic volumes by Fluo-4 following cell permeabilization with digitonin (20 μM) (n = 8-9 per cell type). B) Ca2+ quantification in intracellular volumes by Fluo-4 following cell permeabilization with Triton X-100 (0.1% v/v) (n = 5 per cell type). C) Quantification of Mitosox fluorescence following 2 h intracellular incubation (n = 15 per cell type). D) Quantification of intracellular H2O2 indicator (MAK-164, MilliporeSigma) fluorescence following 2 h intracellular incubation (n = 15 per cell type). E) Quantification of TUNEL reactivity in all cell types without sonication (n = 9 per cell type). Asterisks in all graphs represent p < 0.05 by ANOVA for each measurement. Groups with asterisks in (E) were statistically similar (p < 0.05).

