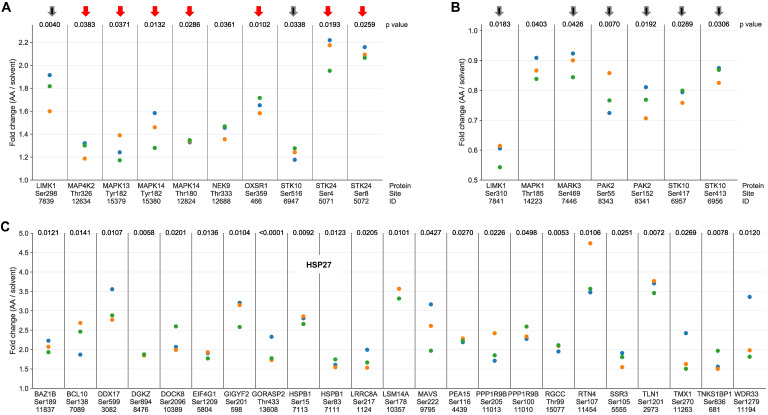
Figure 2.
Phosphosites showing a significant response to AA treatment in MDMs. (A) Protein kinases with phosphosites upregulated by AA versus solvent (p < 0.05 by paired t test; FC > 1.1; n = 3 biological replicates) identified by phosphoproteome analysis. (B) Protein kinases with phosphosites downregulated by AA (p < 0.05; FC < 0.9; n = 3). Red arrows: protein kinases linked to stress response; black arrows: protein kinases associated with actin filament organization. (C) Phosphosites in proteins other than protein kinases strongly upregulated in response to AA treatment ( p < 0.05; FC > 1.7; n = 3). ID refers to the peptide identified by MS in Table S3. Fold change values were calculated by dividing normalized signals (see Materials and Methods). Data points represent individual samples.

