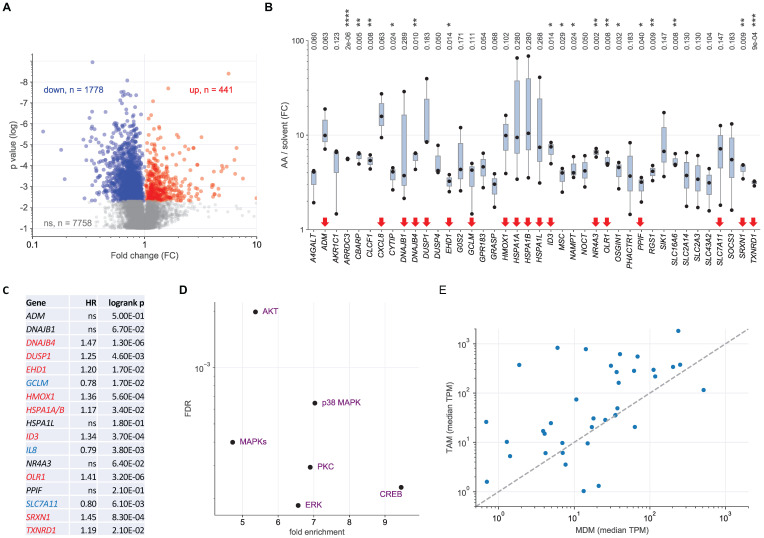
Figure 3.
Transcriptional profiling of AA-treated MDMs and ex vivo TAMs. MDMs were treated with 50 µM AA or solvent for 3 h and RNA was analyzed by next-generation sequencing (RNA-Seq) for 3 independent donors. (A) Volcano plot depicting genes significantly (nominal p < 0.05) repressed by AA (blue), induced (red) by AA) or showing no significant change (grey). (B) RNA-Seq results for the top AA-induced genes (FC > 3; TPM > 3 in AA-treated cells). Red arrows: genes linked to stress response according to GO term enrichment analysis (GO:0006950 in Table S6; genes in Table S8). Box pots show medians (line), upper and lower quartiles (box) and range (whiskers). Significance was tested by paired t test: **** p < 0.0001; *** p < 0.001; ** p < 0.01; * p < 0.05 for AA versus solvent; p values were adjusted for multiple hypothesis testing by Benjamini Hochberg correction. (C) Association of the expression of stress-response-linked genes (red arrows in panel B) with relapse-free survival of serous ovarian cancer according to the Kaplan-Meier Plotter database (see Materials and Methods for details; HSPA1A and HSPA1B are combined in panel C; CXCL8 is referred to as IL8 in panel C). Red letters: positive hazard ratio (HR); blue: negative HR; ns: not significant logrank p value (≥0.05). (D) Ingenuity Upstream Regulator Analysis of the AA-induced genes identified in panel A. The plot shows the regulators with the lowest false discovery rate (FDR: < 0.05) and the strongest enrichment (> 3-fold). (E) Comparison of upregulated genes in MDMs and TAMs (TPM > 1 in TAMs) in an independent dataset (RNA-Seq; see Table S11 for details). The Pearson correlation coefficient for the data points shown is r = 0.32 (p = 0.052).

