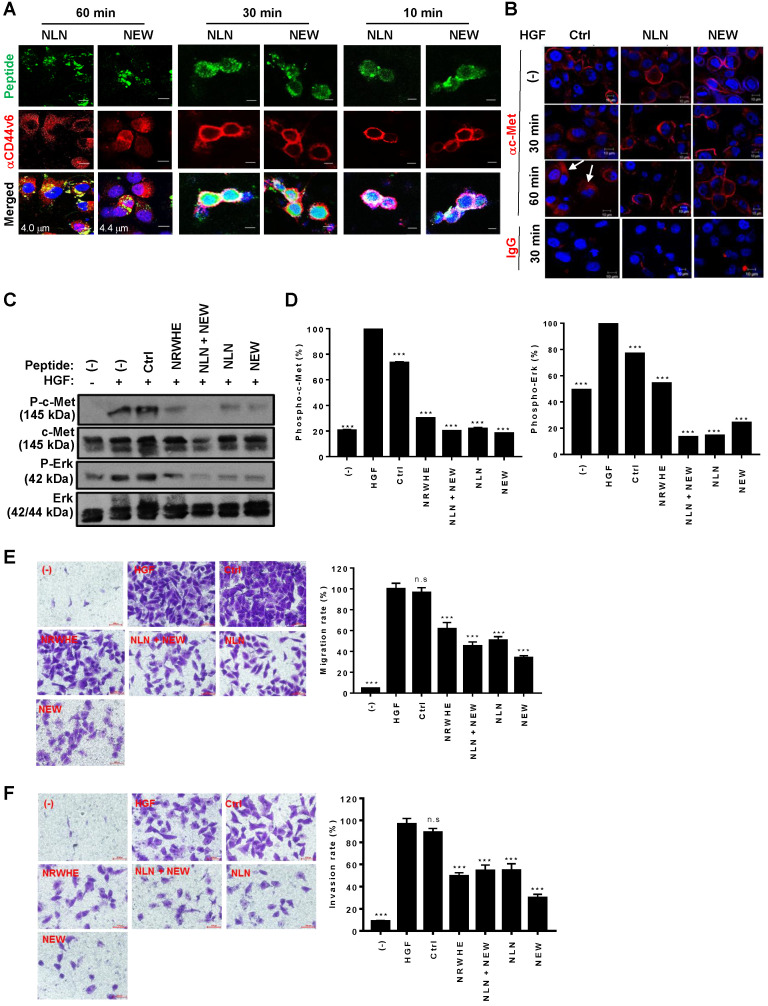
Figure 4.
NLN and NEW inhibit HGF-induced c-Met internalization, c-Met phosphorylation, and cell migration and invasion in MDA-MB231 breast tumor cells. (A) A confocal microscopic Z-section analysis of the internalization of NLN and NEW, and CD44v6 into MDA-MB231 cells. Cells were incubated with FITC-labeled peptides (green, 10 µM) at 37 °C for 10, 30, and 60 min and stained with an anti-CD44v6 antibody (red). Nuclei were stained with DAPI (blue), and images were merged. Numbers in the merged images indicate the distances from the cell surfaces in µm. Scale bars = 10 µm. (B) Confocal microscopic analysis of c-Met (red) in MDA-MB231 cells after pre-treatment with NLN and NEW (10 µM) at 37 °C for 10 min and subsequent treatment with 25 ng/mL HGF for 30 or 60 min. Arrows indicate cytoplasmic c-Met. Nuclei were stained with DAPI (blue). Scale bars = 10 µm. (C) Western blotting analysis of c-Met and Erk phosphorylation in MDA-MB231 cells pre-treated or not with NLN and NEW (20 µM) for 10 min and subsequently treated with 25 ng/mL HGF for 10 min. (D) Phosphorylated c-Met and Erk protein levels normalized by c-Met and Erk total protein levels in MDA-MB231 cells. (E-F) Transwell migration (E) and invasion (F) assays of MDA-MB231 cells pre-treated or not with NLN and NEW (20 µM) for 10 min and subsequently treated with 25 ng/mL HGF for 10 min, followed by incubation for 24 h. Scale bars = 20 µm. Graphs (right panels) represent the quantification of the cell numbers in ten randomly selected fields. Data are shown as the means ± S.E. of three independent experiment. ***, P < 0.001; n.s, not significant compared with HGF by one-way ANOVA.

