Figure 1.
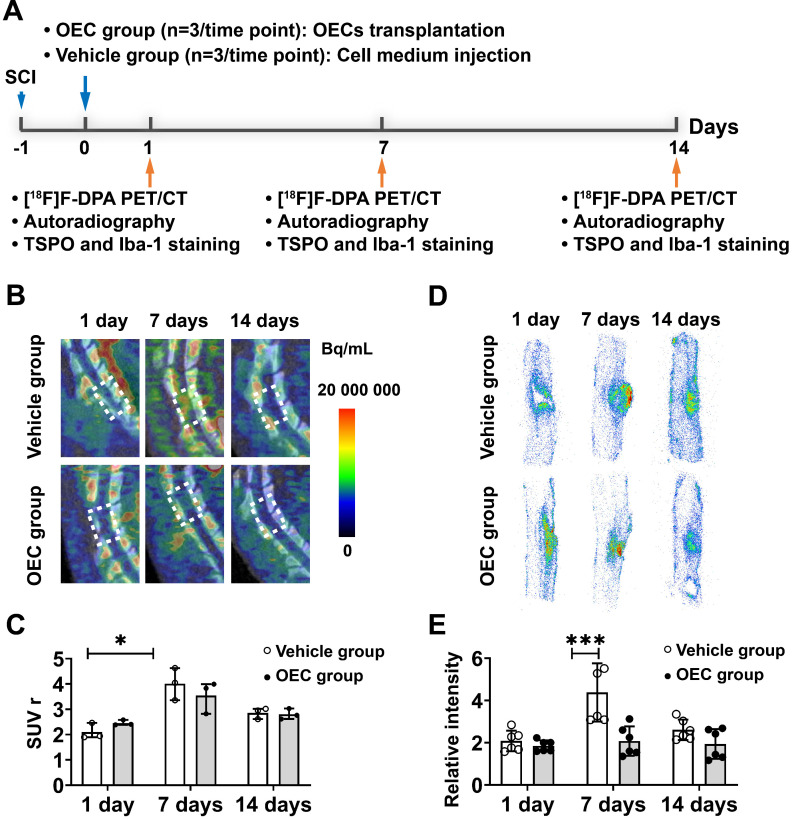
[18F]F-DPA PET/CT imaging and spinal cord autoradiography. (A) Design of the [18F]F-DPA study. (B) Representative [18F]F -DPA PET/CT images and standardized uptake ratio (SUVr) values. Images are summed over 40 - 60 min after injection. (C) Quantification of [18F]F-DPA uptake in the region of interest (ROI) (T11-T13) in the vehicle group and OEC group. (D) Representative [18F]F-DPA autoradiography images. (E) Quantitative analysis of the photostimulated luminescence (PSL/pixel) ratios in the ROI of the vehicle group and OEC group. *p < 0.05, **p < 0.01.

