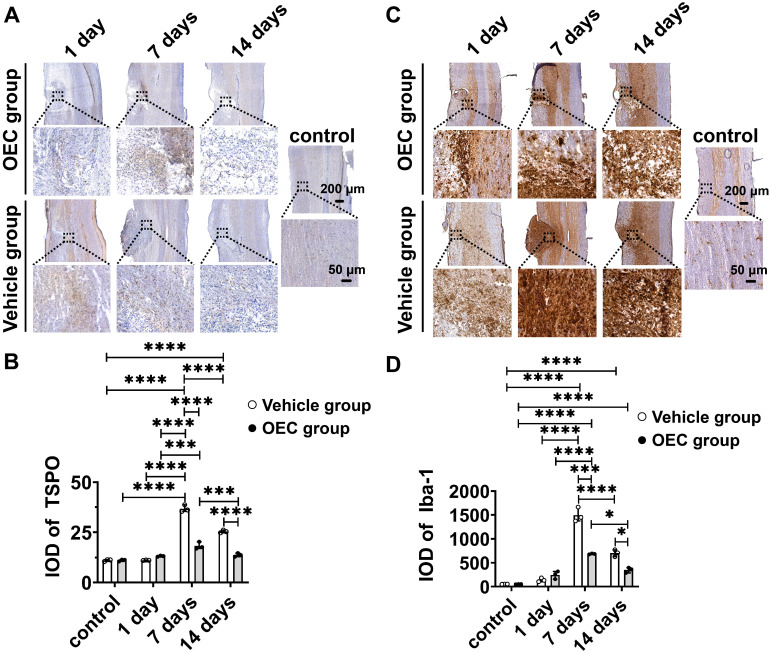
Figure 2.
Immunohistochemical staining of TSPO and Iba-1. (A) TSPO immunostaining in the OEC group, vehicle group, and control group 1, 7, and 14 days after transplantation. (B) Quantification of TSPO expression (integrated optical density, IOD). (C) Iba-1 immunostaining in the OEC group, vehicle group, and control group 1, 7, and 14 days after transplantation. (D) Quantification of Iba-1 expression (IOD). *p < 0.05, ***p < 0.001, ****p < 0.0001; n = 5.

