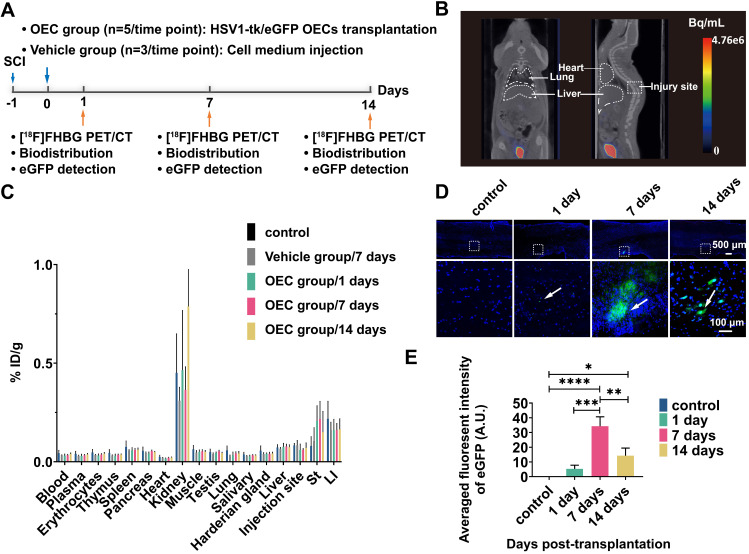
Figure 3.
[18F]FHBG PET/CT imaging and eGFP detection in the spinal cord. (A) Design of the [18F]FHBG study. (B) Representative [18F]FHBG PET/CT images acquired 40 min after injection. (C) Ex vivo biodistribution of [18F]FHBG in the OEC group 1, 7, and 14 days after transplantation, the vehicle group 7 days after injection, and the control group. ST: stomach, LI: large intestine. (D) Detection of eGFP expression at the spinal cord injury site. (E) Quantification of the eGFP fluorescence intensity. **p < 0.01, ***p < 0.001.

