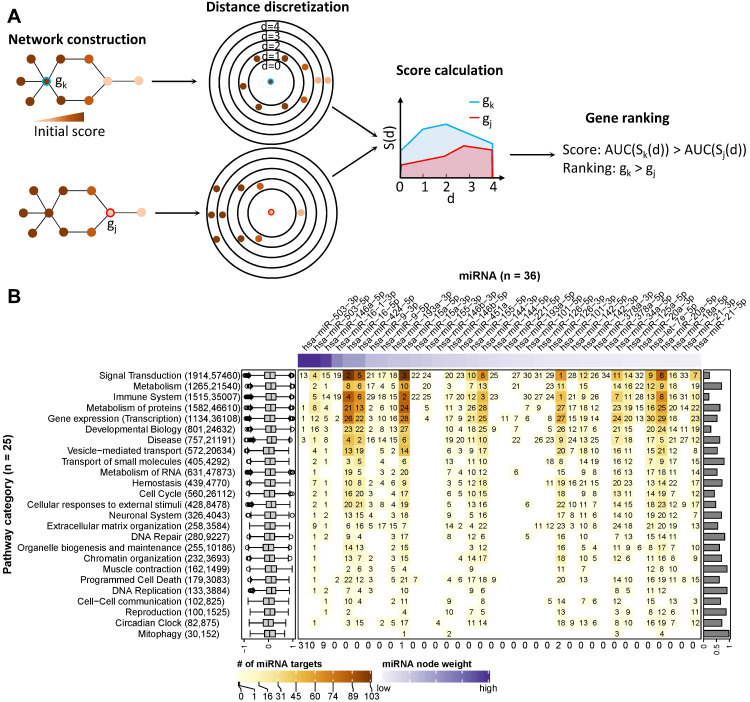
Figure 4.
Ranking of miRNA relevance based on expression and regulatory network neighbourhood. (A) Network nodes were scored with an algorithm that uses the guilt-by-association principle to rank genes. In other words, a gene inside of or close to a cluster of important genes is potentially more important than a gene that is further away. In our case, the importance of a gene for a phenotype is quantified by their perturbation in expression (denoted by node colours). In a network, the distance of the gene in question (red or blue border) to other genes is calculated via the weighted shortest-path method. The range of observed distances is then subdivided into discrete bins (denoted by circles in the figure) and an estimate of neighbourhood importance calculated for each bin, i.e., for all nodes up to the respective distance. The area under the curve (AUC) in the plot of bins (d) vs neighbourhood importance is used as the gene's score. In the example, gene k is much closer to genes with high node weights (i.e., their perturbation in caIKK-DCs is large) than gene j. As a result, the blue area is bigger than the red area, and thus gene k ranks higher than j. (B) Heat map of miRNA ranking in pathway categories. The columns of the matrix indicate the 36 DE miRNAs sorted by perturbation (i.e., node weights), and the rows of the matrix indicate 25 categories of Reactome pathways. The category digestion and absorption is not shown, as we did not identify functional and reliable interactions among its genes. On the heat map grid, the rank of a miRNA in a category is given as a number, and the colour represents the number of protein-coding genes targeted by it. For example, if an entry shows k with a colour corresponding to n on the figure legend, it means that the miRNA ranks kth (1st is the highest ranking) and regulates n targets in the category. A white grid cell means that the miRNA has no targets in the category and thus no ranking. The top annotation shows node weights of the miRNAs. The numbers in parentheses on the left side list how many genes and edges the reconstructed regulatory network of the category possessed. The box plots on the left show the distribution of edge weights (denoted by Pearson correlation coefficients between genes) in the networks. The bar plots on the right show the Pearson correlation coefficients between a miRNA's perturbation and its score. The numbers at the bottom show the number of times miRNAs ranked 1st in the pathway categories.

