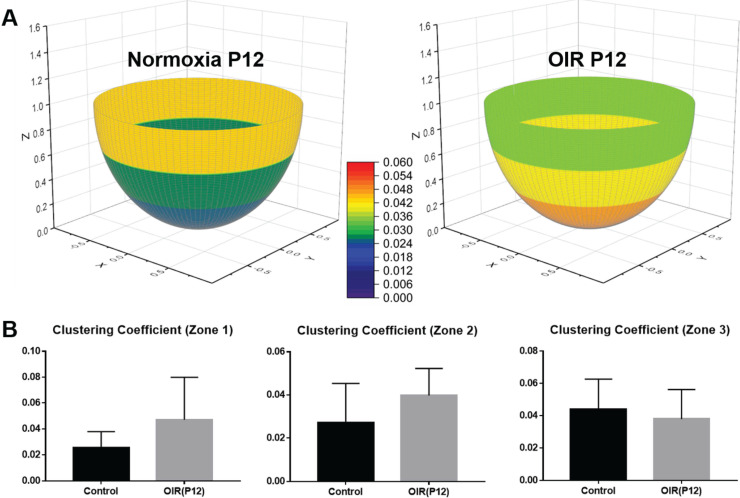
Figure 6.
Average clustering coefficients in different regions of the retina in P12 normoxia and OIR mice. (A) The retinas were divided into three regions (central, middle, peripheral) as previously described. The average clustering coefficients of three individual regions were calculated and compared between the two groups. (B) The average clustering coefficients indicate no statistically significant difference among all three regions in both groups, supporting the notion that the local connections and basic structure of the network are preserved despite vaso-obliteration in OIR retinas (p>0.05 for all comparisons by unpaired two-tailed Student's t-test, n = 5 per group).

