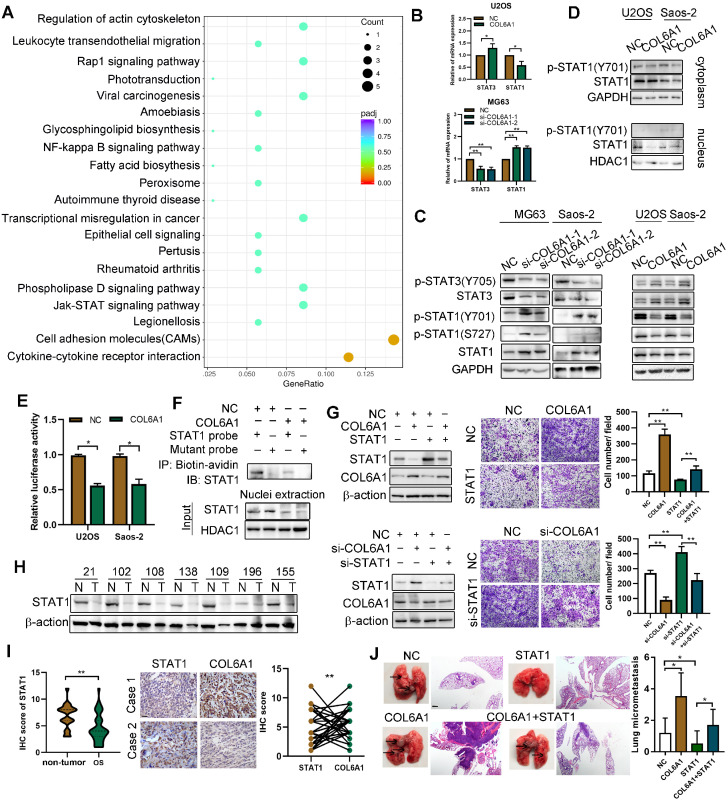
Figure 4.
COL6A1 promotes OS invasion and migration via suppressing STAT1 expression and activation. A. Scatter plot of top 20 KEGG pathways enrichment of DEGs after COL6A1 transfection. Rich factor is the ratio of the DEG number to the background number in a certain pathway. The size of the dots represents the number of genes, and the color of the dots represents the range of the q-value. B. STAT1 and STAT3 mRNA levels were determined in OS cell with COL6A1 or siCOL6A1 transfection by qRT-PCR. C. Total and phosphorylated STAT1 and STAT3 protein expression levels were analyzed in COL6A1 overexpression and knockdown in OS cells by western blot. D. Nuclear and cytoplasmic STAT1 expression was analyzed in COL6A1 overexpression or control OS cells. E. STAT1 transcription luciferase reporter constructs were transiently transfected into the indicated cells, and luciferase activity was analyzed after 48 hours. F. Biotin pull-down assay with a STAT1 probe was used to determine its DNA binding after transfecting COL6A1. G. STAT1 overexpression decreased the migratory ability of COL6A1 overexpression OS cells. The migratory ability of OS cells was detected upon the indicated treatment (right panel). H. The expression of STAT1 in OS tissues was detected by western blot. I. Expression of STAT1 and COL6A1 in OS tissues was detected by immunohistochemistry and COL6A1 inversely correlated with STAT1 expression in human OS tissues (Scale bars: 100 µm). J. Overexpression of STAT1 decreased the rate of lung metastasis after tail-vein injection indicated cells (n = 6 each group). Representative photographs of H&E staining in lung metastases tissues from mice orthotopically inoculated with indicated treated cells (Scale bars: 400 µm). Data represent the mean ± SD of 3 separate determinations. *p < 0.05, **p < 0.01, ***p < 0.001 by Student's t test.

