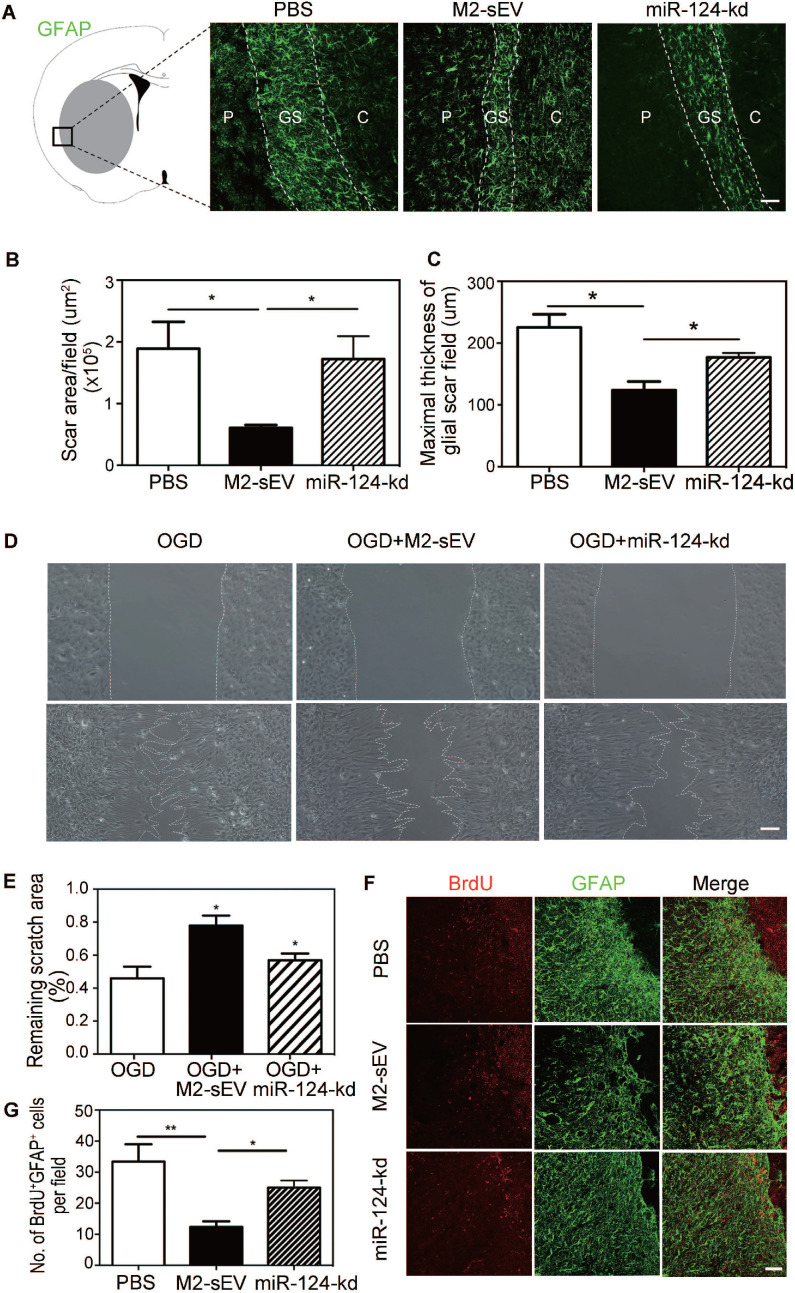
Figure 6.
Downregulation of miR-124 blocked the inhibitory effect of M2-sEVs on glial scar formation after tMCAO. Representative images of GFAP (green) immunostaining in the PBS -, M2-sEV -, and miR-124-kd groups 14 days after tMCAO. C: infarct center, GS: glial scar, P: peri-infarct area. Scale bar = 100 µm. (B, C) Semi-quantification of the glial scar areas and maximal scar thickness per field in the PBS, M2-sEV, and miR-124-kd groups (n = 15). (D) Scratch assay results of cultured astrocytes after 3 h of OGD treatment and reoxygenation for 24 h. 10 µg/mL M2-sEVs as well as miR-124-kd M2-sEVs were pretreated for 24 h before OGD treatment. Scale bar = 50 µm. (E) The remaining scratch areas in the OGD, OGD+M2-sEV, and OGD+miR-124-kd groups at 24 h. (F) Representative images of GFAP (green) and BrdU (red) immunostaining in the PBS and M2-sEV groups 14 days after tMCAO. Scale bar = 50 µm. (G) The number of GFAP+/BrdU+ cells in the PBS, M2-sEV, and miR-124-kd groups 14 days after tMCAO (n = 15). Data are presented as mean ± SEM. **p < 0.01, *p < 0.05.

