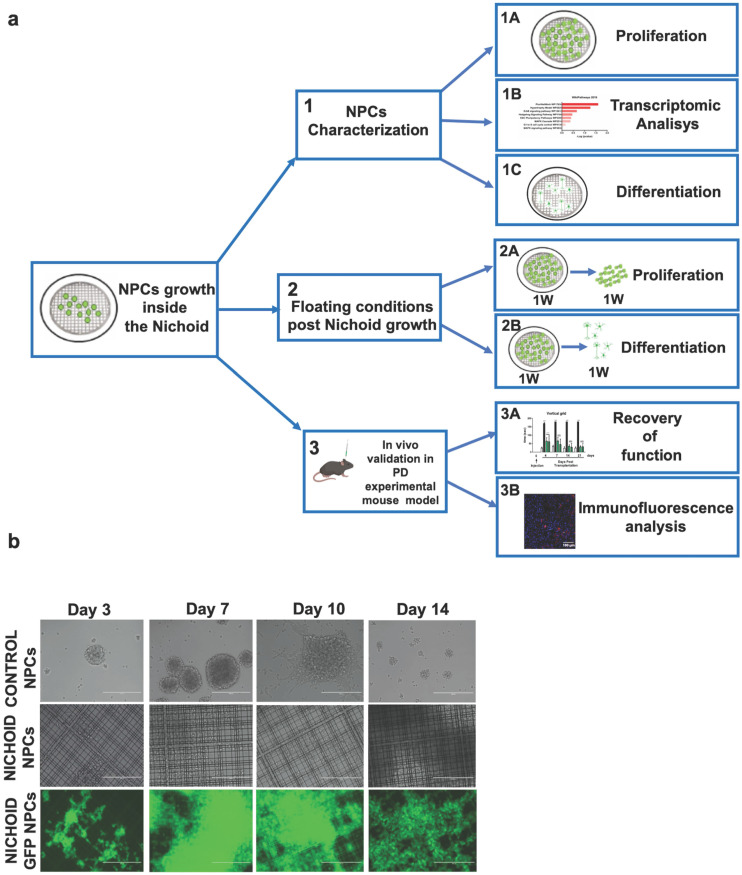
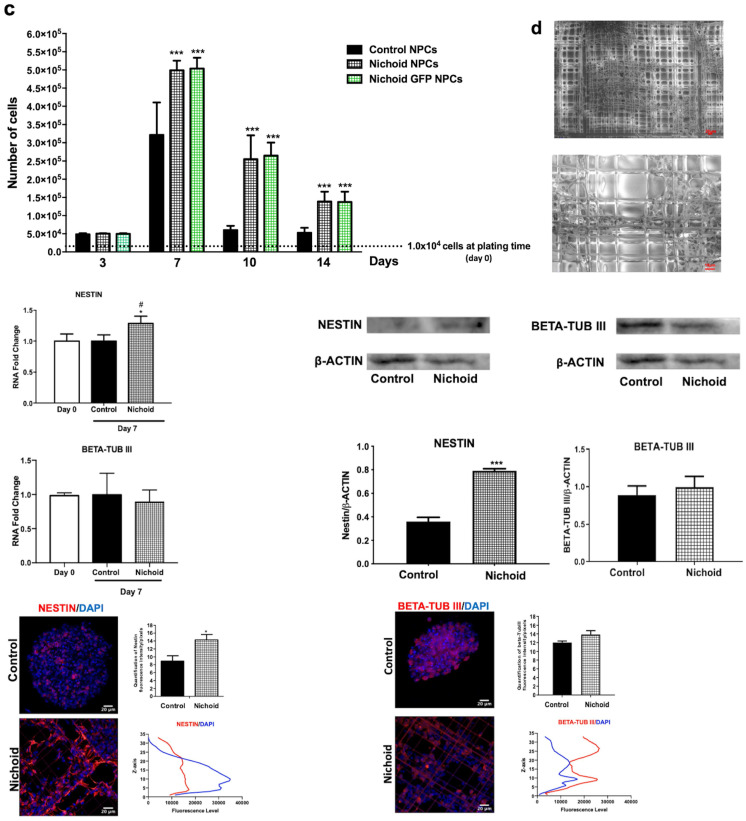
Figure 1.
Proliferation and neural features of NPCs expanded inside the Nichoid. A. Experimental set up of the study. B. Representative in vivo light images of NPCs and GFP-NPCs grown in standard conditions (Control NPCs) or inside the Nichoid (Nichoid NPCs; Nichoid GFP NPCs) at day 3, 7, 10, 14. Scale bars 200 µm. C. Proliferation analysis of NPCs and GFP NPCs grown inside the Nichoid or in standard conditions. 1x10⁴ cells were plated at day 0 and counted with trypan blue exclusion method. Data are expressed as mean ±SD (n=6, ***p<0.001 vs Control NPCs). D. Representative images of Nichoid-grown NPCs analyzed by Environmental Scanning Electron Microscope (ESEM). Scale bars 20 µm and 10 µm. E. mRNA expression levels of Nestin and beta-TubIII of NPCs at day 0 and maintained inside the Nichoid or in standard conditions for 7 days. Results are expressed as mean ±SD (n=3; *p < 0.05 vs Control; #p<0.05 vs Day 0). F. Representative immunoblot images of NESTIN and BETA-TUBIII in NPCs maintained for 7 days inside the Nichoid or in standard conditions (n=2 for NESTIN and n=3 for BETA-TUBIII). Band intensity quantification was measured with ImageJ software. Data correspond to the mean ± SD (***p <0.001 vs Control). G. Representative immunofluorescence images of NESTIN and BETA-TUBIII in NPCs grown inside the Nichoid for 7 days or in standard conditions. Nuclei were stained with DAPI. Scale bars: 20 µm. Fluorescence intensity was quantified with ImageJ software. Data corresponds to mean ± SD (3 fields/3 independent experiments, n=9, *p < 0.05 vs Control). The lower panels show the markers' distribution along the Z axis.


