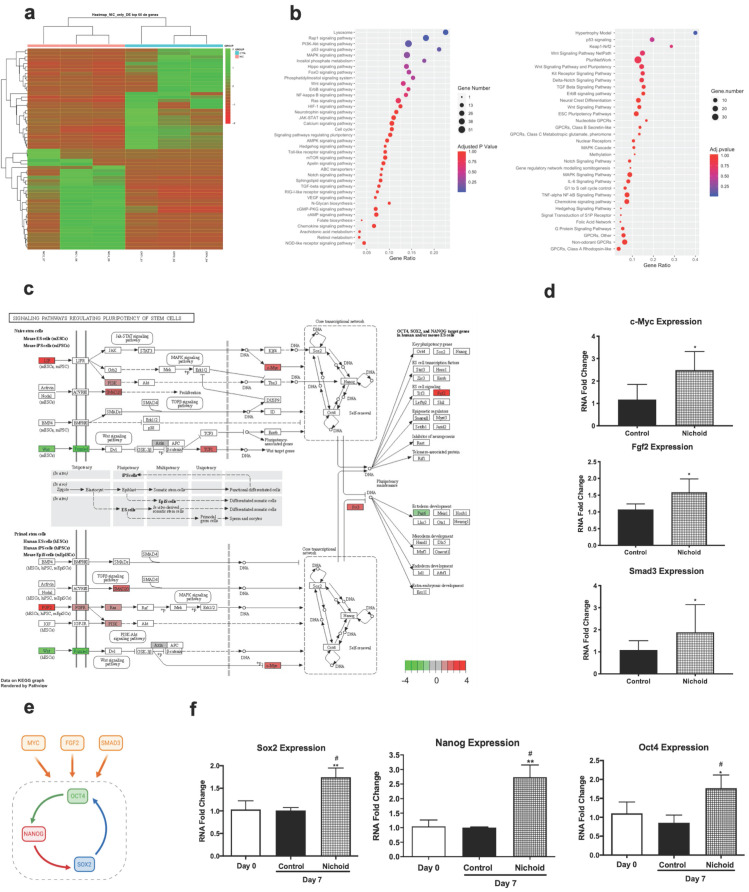
Figure 2.
The Nichoid modifies gene expression inducing pluripotency. A. Expression profiles of differently expressed genes in Nichoid-grown NPCs vs standard conditions reported as a Heatmap. We considered as differentially expressed only genes showing |log2(Nichoid samples/control samples)| ≥ 1 and a False Discovery Rate ≤ 0.1. B. Dot plot graph of KEGG 2019 and WikiPathways 2019 analysis reports significantly deregulated pathways correlated to pluripotency in Nichoid-grown NPCs. The dot's dimension corresponds to the number of genes implicated in each pathway and the color refers to pathway's significance. C. Pathview analysis of signaling pathways regulating pluripotency of stem cells in Nichoid-grown NPCs vs standard conditions. Genes implicated are colored in the pathways, and the color-scale refers to the gene's fold change deregulation. D. c-Myc, Fgf2 and Smad3 mRNA expression levels in Nichoid-grown NPCs versus control. Results are expressed as mean ± SD of three independent experiments performed in duplicate (n=6; *p < 0.05; **p<0.01 vs Control). E. Schematic representation of three genes identified with transcriptome analysis (c-Myc, Fgf2 and Smad3) and their activation of pluripotency genes Oct4, Nanog and Sox2. Made in ©BioRender-biorender.com. F. Sox2, Oct4 and Nanog mRNA expression levels at day 0 and in Nichoid-grown NPCs versus control. Results are expressed as mean ± SD of three independent experiments performed in duplicate (n=6; *p < 0.05; **p<0.01 vs Control; #p < 0.05 vs NPCs at day 0).

