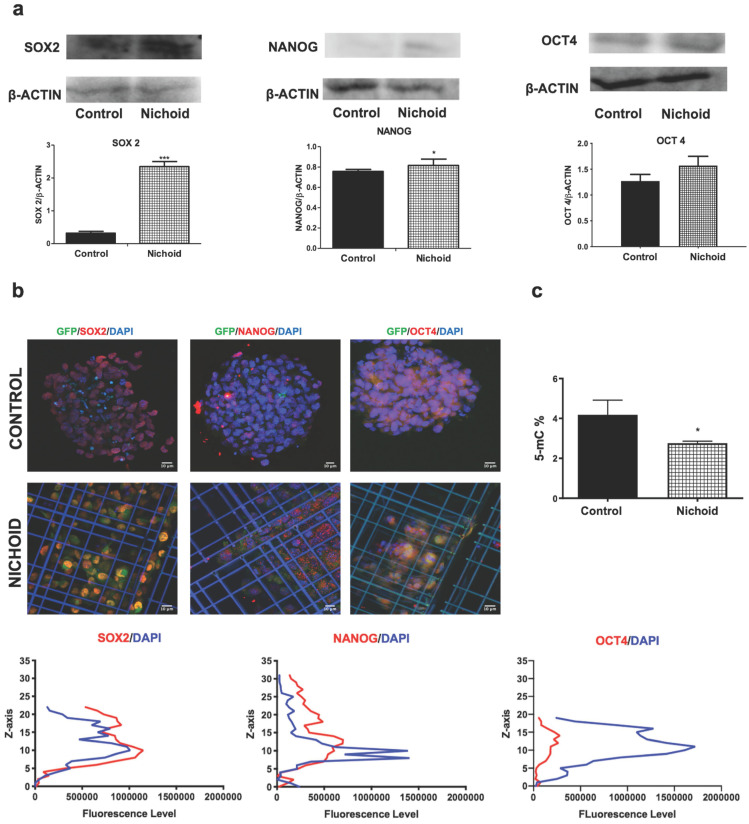
Figure 3.
Induction of protein expression of pluripotency core-network and hypo-methylation in Nichoid-grown NPCs. A. Representative immunoblot images of western blot analysis of SOX2, NANOG and OCT4 in Nichoid-grown NPCs versus control. ß-Actin was used as loading control (n=3). The histograms report the band intensity quantifications, measured with ImageJ software. Data correspond to mean ± SD (*p<0.05; ***p <0.001 vs Control). B. Immunofluorescence analysis of SOX2 (red), NANOG (red) and OCT4 (red) of Nichoid grown NPCs versus control. Nuclei are stained in blue (DAPI). The lower panels show the markers' fluorescence distribution along the Z axis. C. Total DNA methylation of Nichoid-grown NPCs versus control. Results are expressed as mean ± SD (*p <0.05 vs Control).

