Figure 6.
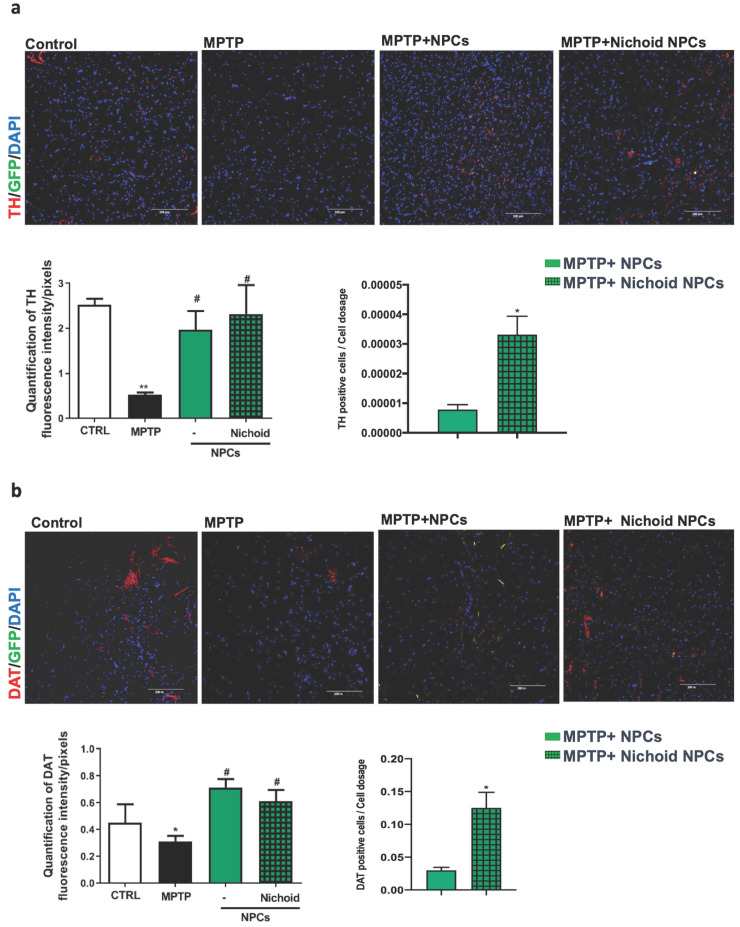
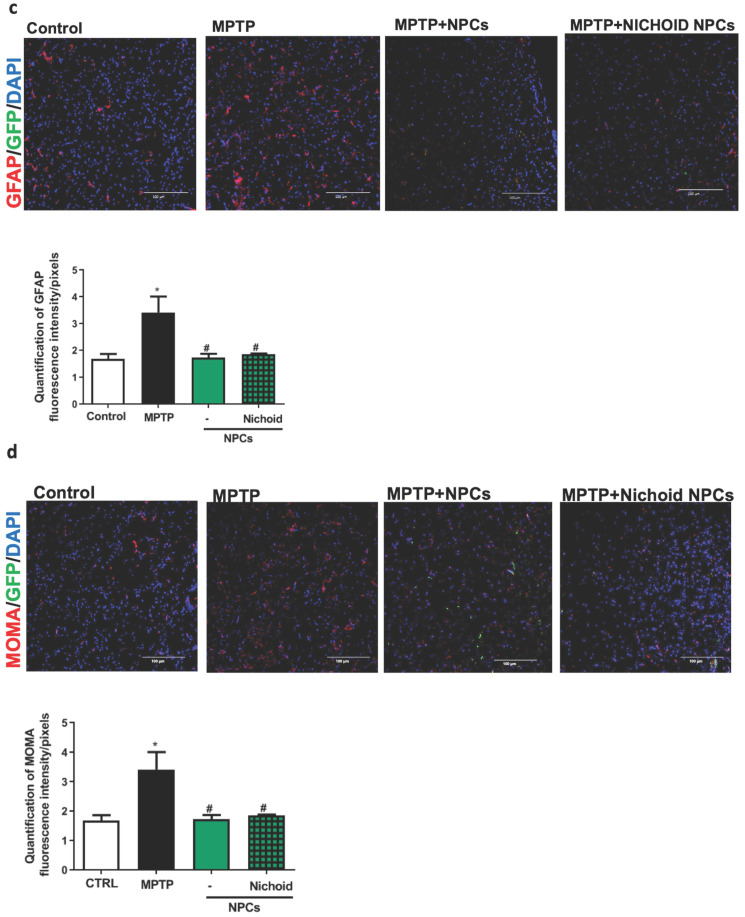
NPCs expanded inside the Nichoid promote dopaminergic recovery and reduced inflammation. A. Immunofluorescence images of TH-staining in striatum sections. Nuclei are stained with DAPI. Scale bars=100 µm. The histogram reports TH fluorescence intensity. Data are expressed as mean ± SD (n=3; **p <0.01 vs Control, #p <0.05 vs MPTP). The adjacent histogram reports the percentage of positive cells normalized to the dosage of transplanted NPCs. Data are expressed as mean ±SD (n=3; *p <0.05 vs MPTP-NPCs). B. Immunofluorescence images of DAT expression in striatum sections. Nuclei are stained with DAPI. Scale bar: 100μm. The histogram reports DAT fluorescence intensity. Data are expressed as mean ± SD (n=3: *p <0.05 vs Control, #p <0.05 vs MPTP). C. Immunofluorescence images of GFAP expression and morphology in striatum sections. Nuclei are stained with DAPI. The histograms report the quantification of GFAP-fluorescence intensity. Data are expressed as mean ± SD (n=3 *p <0.05 vs Control, #p <0.05 vs MPTP). Scale bar: 100 µm. D. Immunofluorescence images of MOMA (CD68)-labeled striatum sections. The histogram reports GFAP fluorescence intensity. Data are expressed as mean ± SD (n=3 *p <0.05 vs Control, #p <0.05 vs MPTP). Scale bar: 100 µm.


