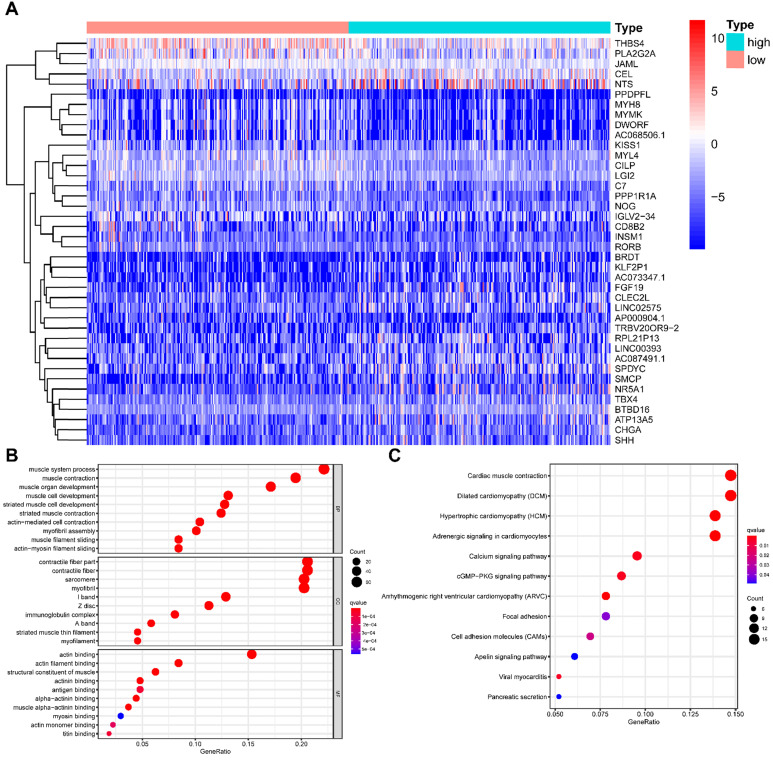
Figure 4.
Comparisons of gene expression profiles in high- and low-TMB samples. (A) Top 40 DEGs were shown in the heatmap plot; (B) Functional analysis of the top 10 enriched biological processes (BPs), cell composition (CC), and molecular function (MF) of GO analysis; (C) KEGG enrichment diseases analysis. TMB, tumor mutation burden; DEGs, differentially expressed genes.

