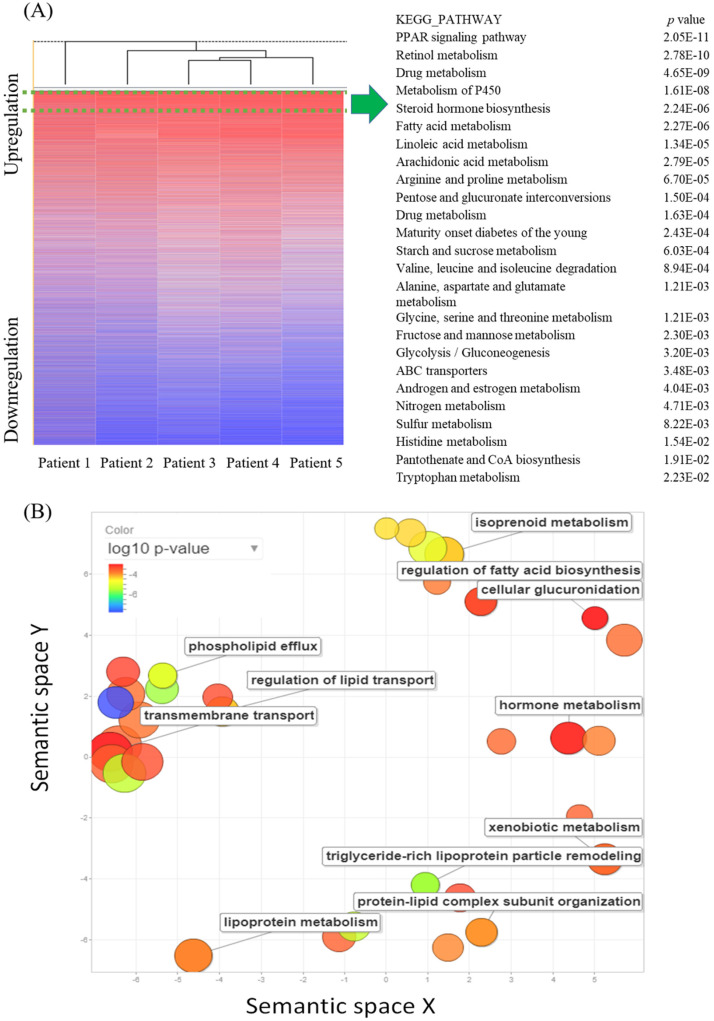
Figure 1.
Complementary (c)DNA microarray comparing gene expressions in ampullary cancer with those of normal duodenal tissues. (A) The heatmap shows gene rankings from the highest to lowest after normalization. The peroxisome proliferator-activated receptor (PPAR) signaling pathway had the highest expression. The top 25 Kyoto Encyclopedia of Genes and Genomes (KEGG) pathways are listed with their p values. (B) Gene Ontology (GO) scatterplot constructed by REVIGO. Individual circles indicate representative clusters. The color of the circles indicates p values of the GO analysis (legend in the upper left-hand corner). The size of the circles indicates the frequency of the GO term in the underlying database; the larger the circle, the higher the frequency of gene expression.

