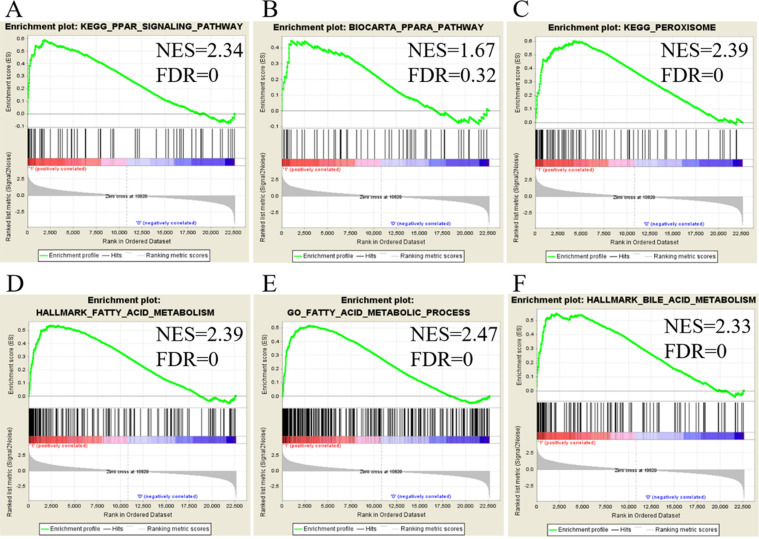
Figure 4.
Analysis of upregulated genes in ampullary cancer by the Kyoto Encyclopedia of Genes and Genomes (KEGG), BioCarta, Gene Ontology (GO), and Hallmark databases. The enrichment score (y-axis) reflects the increased degree of associated genes in ampullary cancer (Y = 1 = cancer) compared to normal duodenal tissues (Y = 0 = normal). The green line indicates the evolution of the density of genes identified in the microarray dataset. The horizontal bar in a gradation of red to blue represents the rank of genes in the ordered dataset. Genes on the left side (red) were correlated with the most strongly associated ones, while genes on the right side (blue) are those with negative correlation. Each solid bar in the middle represents each gene within a gene set. A normalized enrichment score (NES) was employed to compute the density of modified genes in the microarray with random expectancies. The false discovery rate (FDR) is the estimated probability with a given NES and is represented as a false positive finding. All p values were < 0.001. (A) Peroxisome proliferator-activated receptor (PPAR) signaling in the KEGG. (B) PPARA signaling in BioCarta. (C) Peroxisome in the KEGG. (D) Fatty acid metabolism in Hallmark. (E) Fatty acid metabolism in GO. (F) Bile acid metabolism in Hallmark.

