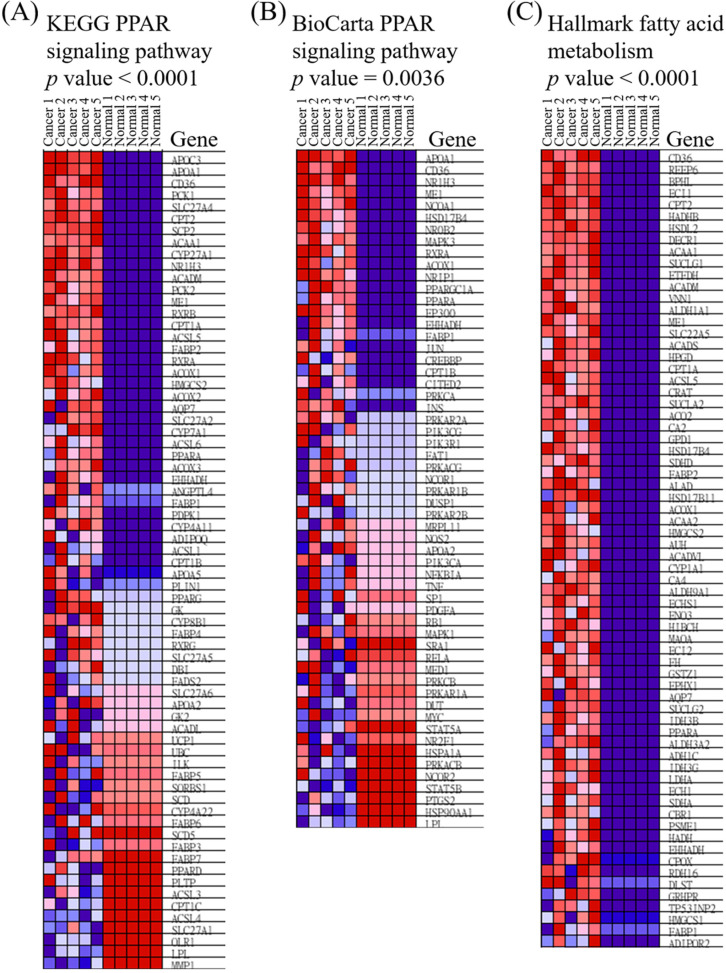
Figure 5.
Heatmap of expressed genes in ampullary cancer and normal duodenal tissues. (A) Peroxisome proliferator-activated receptor (PPAR) signaling pathway in the Kyoto Encyclopedia of Genes and Genomes (KEGG). (B) PPAR in BioCarta. (C) Fatty acid metabolism in Hallmark. The color gradient matches the ranking of particular genes in ampullary cancer. Red indicates upregulation, and blue indicates downregulation.

