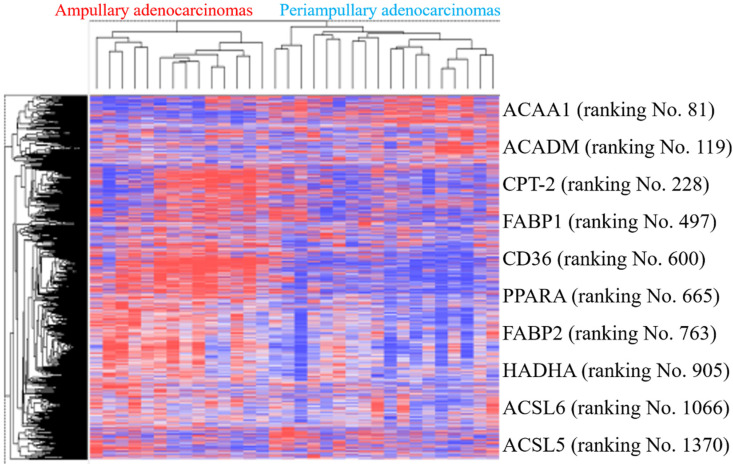
Figure 6.
Heatmap of expression (cancer/normal) ratios in the GSE39409 dataset. The top highly expressed genes in ampullary cancer tissues were identified by hierarchical clustering with Pearson's coefficient. Genes in the heatmap represent the top 10% of genes with the highest correlation coefficients in ampullary adenocarcinomas compared to periampullary adenocarcinomas. Genes listed on the right side include peroxisome proliferator-activated receptor alpha (PPARA) signaling and lipid metabolism-related ones.

