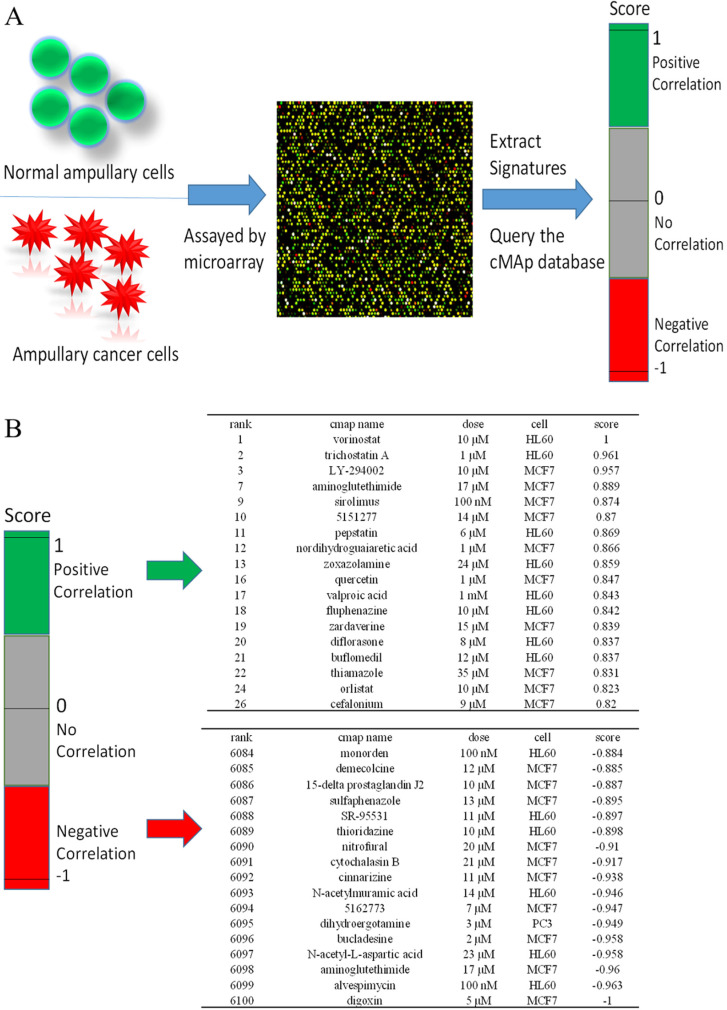
Figure 8.
Connectivity Map (CMap) analysis based on differential expressions of genes in the microarray. (A) Flowchart of the study protocol. Results of the CMap analysis are represented as +1 (top, lowest potential of inhibition) to -1 (bottom, highest potential of inhibition). Drugs with a positive score are presented in green, while those with negative connectivity score are displayed in red. (B) The top 18 and the bottom 17 drugs were ranked according to their score.

